

MQL5 Custom Symbols: Creating a 3D Bars Symbol
 1 863
1 863
 1
1

Modern trading requires unconventional approaches to data analysis. Traditional price charts, while useful, often do not tell the whole story of market dynamics. Price is just one aspect, while trading volume, volatility, and time patterns can provide deeper insight into the market.
The MetaTrader 5 platform and MQL5 language provide a powerful tool — custom symbols — that allow traders to create synthetic assets based on arbitrary data. In this article, we will take a detailed look at the 3DBarCustomSymbol.mq5 indicator, which generates a custom symbol representing 3D bars. These bars combine price, time, volume, and volatility into a unique analytical and visualization tool.
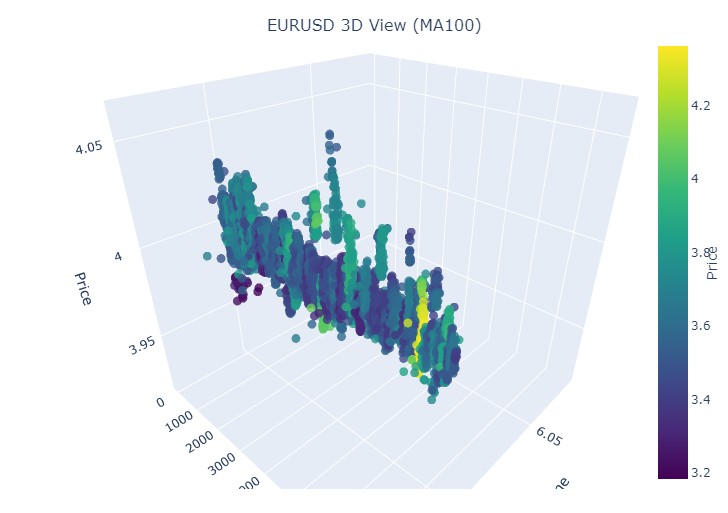
3D bars are a way to enrich standard charts with additional dimensions. They allow traders to see not only price movements, but also parameters such as trading intensity, market volatility, and cyclical time patterns. This approach can reveal hidden patterns that remain invisible when using regular candlestick charts.
The 3DBarCustomSymbol indicator demonstrates how to use MQL5 capabilities to create a custom symbol that can be integrated into trading strategies or used for visual analysis.
The evolution of market data analysis
Market analysis has evolved from simple paper charts to sophisticated computer methods and microstructure studies (volumes, order flow, trading intervals, cluster volatility). But most approaches remained fragmented.
3D bars combine four key dimensions in a single chart:
- price: OHLC data, speed and acceleration of movements, distribution statistics;
- volume: total volume, distribution by levels, intensity, anomalies, aggressive buy/sell ratio;
- time: intra-session cycles, rate of formation, temporal correlations, seasonal effects;
- volatility: local and global, clustering, abnormal spikes, relationship with volume.
This gives a complete picture of the market and helps to quickly identify patterns and anomalies. Additionally, 3D bars are easier to process visually, which reduces cognitive load and speeds up decision-making, especially in high-frequency trading. The custom indicator is easily integrated into MetaTrader 5 for various strategies, from scalping to long-term ones.
Mathematical formalization of the concept
A 3D bar can be mathematically described as a vector in a multidimensional space:
B₃D = (P, V, T, σ)
where:
- P — price vector (open, high, low, close, typical_price)
- V — volume vector (volume, volume_profile, volume_acceleration)
- T — time vector (time_sin, time_cos, time_acceleration)
- σ — volatility vector (local_volatility, global_volatility, volatility_change)
Each component contains both static (historical) and dynamic (real-time) elements.
Indicator architecture
The indicator architecture is based on the separation of concerns principle:
Initialization module is responsible for:
- checking the availability of the source symbol,
- validation of inputs,
- setting global variables,
- creating the necessary data structures.
Symbol creation module includes:
- functions for creating a custom symbol,
- setting up symbol properties,
- configuring trading sessions,
- assigning metadata.
Data processing module contains:
- algorithms for calculating metrics,
- normalization and scaling functions,
- statistical calculations,
- exception handling.
Update module provides:
- monitoring new data,
- recalculation of current metrics,
- updating a custom symbol,
- performance optimization.
Detailed analysis of inputs
The indicator offers flexible configuration through customizable inputs. Here is an example of how they are defined in code:
input string   SourceSymbol = "EURUSD";        // Source symbol
input string   CustomSymbolName = "EURUSD_3D"; // Custom symbol name
input int      LookbackPeriod = 20;            // Lookback period
input int      HistoryDays = 100;              // Number of history days
input bool     CreateWindow = true;            // Create a chart window
input bool     UpdateInRealTime = true;        // Update in real time
input bool     ShowPrice = true;               // Show a regular price
input double   MinSpreadMultiplier = 45;       // Spread multiplier
input double   VolumeBrick = 500;              // Volume block size
input double   ScaleMin = 3.0;                 // Minimum scale value
input double   ScaleMax = 9.0;                 // Maximum scale value
where:
- SourceSymbol — basic financial instrument for analysis. All symbols available in MetaTrader 5 are supported, including currency pairs, stocks, commodities, indices and cryptocurrencies.
- CustomSymbolName — unique name for the custom symbol being created. It is recommended to use descriptive names that reflect the essence of the data transformation.
- LookbackPeriod — size of the sliding window for calculating statistical metrics. Affects the indicator's sensitivity to short-term changes. Small values (5-10) provide high sensitivity, large values (50-100) provide smoothed signals.
- HistoryDays — depth of historical data for initialization. Affects loading time and the accuracy of long-term statistics. Optimal values: 30-365 days depending on the analysis goals.
- MinSpreadMultiplier and VolumeBrick — critical parameters that determine the sensitivity of the algorithm to changes in price and volume, respectively.
- ScaleMin and ScaleMax — normalization range of all metrics. The range 3-9 is chosen based on numerological considerations and improves visual interpretability.
The OnInit function performs initial setup. It checks the existence of the original symbol, calculates the price block size based on the spread, creates a custom symbol and populates it with historical data. Here is the key code snippet:
int OnInit()
{
   if(!SymbolSelect(SourceSymbol, true))
   {
      Print("Error: symbol ", SourceSymbol, " not found!");
      return INIT_FAILED;
   }

   double spread = SymbolInfoDouble(SourceSymbol, SYMBOL_ASK) - SymbolInfoDouble(SourceSymbol, SYMBOL_BID);
   double point = SymbolInfoDouble(SourceSymbol, SYMBOL_POINT);
   minPriceBrick = spread * MinSpreadMultiplier * point;

   if(!Create3DBarSymbol())
   {
      Print("Error creating custom symbol!");
      return INIT_FAILED;
   }

   if(!GenerateHistorical3DBars())
   {
      Print("Error generating historical data!");
      return INIT_FAILED;
   }

   if(CreateWindow)
   {
      OpenCustomChart();
   }

   if(UpdateInRealTime)
   {
      EventSetTimer(5);
   }

   Print("3D bars symbol ", CustomSymbolName, " successfully created!");
   return(INIT_SUCCEEDED);
}
The Create3DBarSymbol function configures properties of a custom symbol, such as precision, tick size, and quote currencies. It also sets the trading sessions to run 24/7. Example:
bool Create3DBarSymbol()
{
   if(SymbolSelect(CustomSymbolName, true))
   {
      CustomRatesDelete(CustomSymbolName, 0, 0);
      Print("Symbol ", CustomSymbolName, " already exists. History deleted.");
      return true;
   }

   int digits = (int)SymbolInfoInteger(SourceSymbol, SYMBOL_DIGITS);
   double point = SymbolInfoDouble(SourceSymbol, SYMBOL_POINT);
   double tickSize = SymbolInfoDouble(SourceSymbol, SYMBOL_TRADE_TICK_SIZE);
   double contractSize = SymbolInfoDouble(SourceSymbol, SYMBOL_TRADE_CONTRACT_SIZE);
   string baseCurrency = SymbolInfoString(SourceSymbol, SYMBOL_CURRENCY_BASE);
   string profitCurrency = SymbolInfoString(SourceSymbol, SYMBOL_CURRENCY_PROFIT);

   if(!CustomSymbolCreate(CustomSymbolName))
   {
      Print("Error creating custom symbol: ", GetLastError());
      return false;
   }

   CustomSymbolSetInteger(CustomSymbolName, SYMBOL_DIGITS, digits);
   CustomSymbolSetDouble(CustomSymbolName, SYMBOL_POINT, point);
   CustomSymbolSetDouble(CustomSymbolName, SYMBOL_TRADE_TICK_SIZE, tickSize);
   CustomSymbolSetDouble(CustomSymbolName, SYMBOL_TRADE_CONTRACT_SIZE, contractSize);
   CustomSymbolSetString(CustomSymbolName, SYMBOL_CURRENCY_BASE, baseCurrency);
   CustomSymbolSetString(CustomSymbolName, SYMBOL_CURRENCY_PROFIT, profitCurrency);

   string description = "3D bars (price, time, volume, volatility). Lookback: " + IntegerToString(LookbackPeriod);
   CustomSymbolSetString(CustomSymbolName, SYMBOL_DESCRIPTION, description);

   for(int day=0; day<7; day++)
   {
      datetime start_time = 0;
      datetime end_time = 24*60*60-1;
      CustomSymbolSetSessionQuote(CustomSymbolName, (ENUM_DAY_OF_WEEK)day, 0, start_time, end_time);
      CustomSymbolSetSessionTrade(CustomSymbolName, (ENUM_DAY_OF_WEEK)day, 0, start_time, end_time);
   }

   return true;
}
GenerateHistorical3DBars function handles historical data, calculating metrics such as price returns, price acceleration, volume changes, and volatility. It uses M15 timeframe to obtain basic data. Here is part of the code:
bool GenerateHistorical3DBars()
{
   datetime endTime = TimeCurrent();
   datetime startTime = endTime - HistoryDays * 24 * 60 * 60;

   MqlRates rates[];
   int copiedRates = CopyRates(SourceSymbol, PERIOD_M15, startTime, endTime, rates);

   if(copiedRates <= 0)
   {
      Print("Error copying historical data: ", GetLastError());
      return false;
   }

   MqlRates threeDBars[];
   ArrayResize(threeDBars, copiedRates);
   int validCount = 0;

   double typicalPrices[], priceReturns[], priceAccelerations[], volumeChanges[], volatilities[];
   ArrayResize(typicalPrices, copiedRates);
   ArrayResize(priceReturns, copiedRates);
   ArrayResize(priceAccelerations, copiedRates);
   ArrayResize(volumeChanges, copiedRates);
   ArrayResize(volatilities, copiedRates);

   for(int i = 0; i < copiedRates; i++)
   {
      typicalPrices[i] = (rates[i].high + rates[i].low + rates[i].close) / 3.0;

      if(i > 0)
      {
         priceReturns[i] = (typicalPrices[i] - typicalPrices[i-1]) / typicalPrices[i-1];
         priceAccelerations[i] = i > 1 ? priceReturns[i] - priceReturns[i-1] : 0;
      }
      else
      {
         priceReturns[i] = 0;
         priceAccelerations[i] = 0;
      }

      volumeChanges[i] = i > 0 ? (rates[i].tick_volume - rates[i-1].tick_volume) / (rates[i-1].tick_volume + 1e-10) : 0;

      if(i >= LookbackPeriod)
      {
         double returns[];
         ArrayResize(returns, LookbackPeriod);
         for(int j = 0; j < LookbackPeriod; j++)
            returns[j] = priceReturns[i - LookbackPeriod + j + 1];
         volatilities[i] = CalculateStdDev(returns);
      }
      else
      {
         volatilities[i] = 0;
      }
   }
   // Next comes filling the 3D bars and adding them to the history
}
The UpdateCurrent3DBar function ensures that the current bar is updated every 5 seconds if the UpdateInRealTime parameter is enabled. It calculates the same metrics for the current bar and updates the custom symbol.
double ScaleValue(double value, double &values[], int start, int end)
{
   double minVal = values[start];
   double maxVal = values[start];

   for(int i = start; i <= end; i++)
   {
      if(values[i] < minVal) minVal = values[i];
      if(values[i] > maxVal) maxVal = values[i];
   }

   if(maxVal == minVal) return ScaleMin;

   return ScaleMin + (ScaleMax - ScaleMin) * (value - minVal) / (maxVal - minVal);
}
The OpenCustomChart function opens a chart of a custom symbol, which can be displayed in candlestick or line format, depending on the ShowPrice parameter.
Practical use
The indicator allows analyzing volatility, identifying anomalies in volume or price acceleration, and integrating a custom symbol into trading systems.
To get started, compile the code in MetaEditor and add the indicator to a chart, for example, EURUSD M15. Set parameters, such as CustomSymbolName and LookbackPeriod, and the indicator will create a custom symbol that can be opened in a separate window. If the ShowPrice parameter is enabled, the chart will show standard prices with overlaid metrics; otherwise, it will only show synthetic 3D bars.
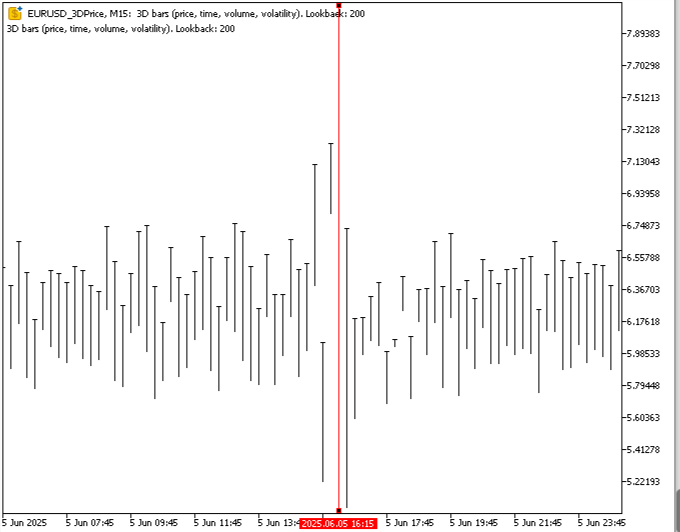
Here is a typical chart:
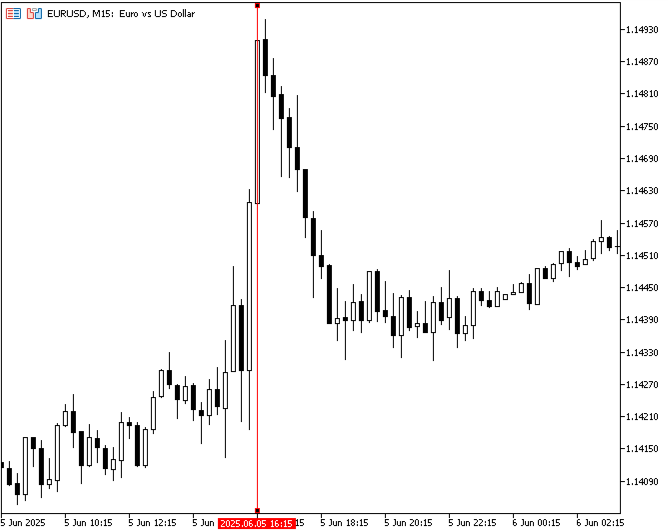
Traders can use 3D bars to identify periods of increased volatility that signal news events or to detect anomalies such as volume spikes. The custom symbol can be combined with indicators, such as moving averages, or used in Expert Advisors for automated trading.
The indicator can be improved by adding support for other timeframes, such as H1 or D1, to analyze larger movements. Including additional metrics, such as correlation with other assets, can make the indicator more informative. To optimize performance, limit HistoryDays, especially on low-end PCs. Visualization can be enhanced by adding indicators, such as Bollinger Bands, or filters to highlight anomalies, such as bars with extreme volatility.
Generating a large amount of historical data can be resource intensive, so start with a small HistoryDays. The M15 timeframe is suitable for most instruments, but for low-liquidity assets it is better to use longer periods. Before real trading, test the indicator on a demo account to ensure it works correctly. Interpreting 3D bars requires experience, so study their behavior on historical data.
Conclusion
The 3DBarCustomSymbol indicator demonstrates the power of custom symbols in MQL5. By combining price, time, volume and volatility, it creates a unique tool for market analysis. 3D bars are suitable for visual analysis, creating trading systems, and identifying hidden patterns. Adapt the indicator to your needs, experiment with the parameters, and test it on a demo account. MQL5 opens up limitless possibilities for innovation in trading, and 3DBarCustomSymbol is a prime example of how these capabilities can be used to create powerful analytical tools.
Translated from Russian by MetaQuotes Ltd.
Original article: https://www.mql5.com/ru/articles/18681
Warning: All rights to these materials are reserved by MetaQuotes Ltd. Copying or reprinting of these materials in whole or in part is prohibited.
This article was written by a user of the site and reflects their personal views. MetaQuotes Ltd is not responsible for the accuracy of the information presented, nor for any consequences resulting from the use of the solutions, strategies or recommendations described.


 CSV Data Analysis (Part 2): Building a Production-Grade CSV Export and Parsing Pipeline for Quantitative Strategy Analysis
 Position Management: A Reusable Trade Journal with Live Maximum Adverse Excursion, Maximum Favorable Excursion, and R-Multiple Tracking in MQL5
 Step-by-Step Implementation of a Local Stop Loss System in MQL5
 CSV Data Analysis (Part 1): CSV Export Engine for MQL5 Multi-Core Optimizations

- Free trading apps
- Over 8,000 signals for copying
- Economic news for exploring financial markets
You agree to website policy and terms of use