
Night trading during the Asian session: How to stay profitable

Introduction
Many traders often come across the notion of night trading. The first thing that comes to mind when meeting this concept is that trading is carried out at night. However, everything is simpler: because of the difference in time zones, the night in different parts of the world comes at different times. American and European trading sessions take place in time zones -4 and +1 relative to the UTC World Coordinated Time, respectively.
They are followed by Asian and Pacific exchanges whose time zones are opposite to that of their American and European counterparts. Here, trading starts when American traders go home, while European traders go to bed. This is the night trading in our current understanding. Trading session periods can be displayed the following way (Fig. 1, time goes from right to left):

Fig. 1. Trading sessions on the world map
Apparently, the night trading generally shows flat movement on such pairs as EURUSD, GBPUSD, USDCHF, USDCAD and EURGBP, but shows significant activity on USDJPY, GBPJPY and AUDJPY. Of course, this may not happen from day to day. Thus, there may be different night time trading strategies for different currency pairs.
Night trading strategies
Generally, all Forex trading strategies can be roughly divided into trend and flat ones. The first ones search for market reversal signals. Mostly, they look for horizontal channel breakthroughs or roll-backs from "bullish" and "bearish" channels. The second ones are focused on roll-backs within the horizontal channel borders. Both flat and trend markets may show different volatility, which often grows during important macroeconomic news releases. In practice, high volatility often occurs during trend movements, although there are exceptions. The same indicators can be applied to analyze both trend and flat signals, although they are interpreted differently.
Let's take the popular EURUSD pair. During the Asian session, its volatility usually decreases and it starts moving in flat. A roll-back at this stage is often insignificant and may resemble a horizontal movement.

Fig. 2. Flat movement on EURUSD during the Asian session
Fig. 2 yellow rectangles indicate EURUSD movement on H1 during the Asian session. The first one (on the left) demonstrates a small intra-channel oscillation. At the beginning of the session, the price follows the previously created trend, then a small correction occurs (in the middle of the session) only to turn into a sharp roll-back in the end. The second rectangle shows a slow upward movement, which in this case repeats the movement at the end of the day. The third rectangle demonstrates a slight change. Unlike the previous sessions, the initial night time movement corrects the daily trend.
In all described cases, we can see small movements within the price range during the Asian session. It seems like the market shows "uncertainty". Such a movement can be treated as flat.
We can see upper and lower borders on yellow rectangles. They limit the channel the price fluctuates in. It is easy to draw a channel on an already formed chart. But in real time, we have no idea how the price will move, and volatility remains questionable. So, what should we do?
I propose solving this issue by using the Bollinger Bands trend indicator showing good signals during a flat.

Fig. 3. Using Bollinger Bands on EURUSD M30
Fig. 3 shows EURUSD М30 chart with Bollinger Bands attached. The selected period is as low as possible (10), other settings are left by default. Here we can see how the price falls into the so-called "dynamic channel" created by the indicator. However, the channel's signals are not accurate enough. For example, in the first rectangle, the price moves down, and the channel follows it. At the same time, the price does not bounce off the lower border of the channel, although everything changes by the end of the Asian session. The market begins to rebound from the channel limiters. On the second rectangle, the indicator's action can be seen only in the end. The third rectangle shows the situation similar to the first one.
As we can see, accurate signals are formed only towards the end of each three sessions. As we can see some regularity, we may use it to build a strategy.
Now, let's turn to another strategy based on a sharp volatility. For the Asian session, these are JPY pairs. This strategy is widely described on the Web. Its idea is to enter the market at the most volatile moment when a sharp movement is possible in any direction. Two pending orders (above the current price - the buy one, below it - the sell one) are placed simultaneously at equal distance in opposite directions. The orders are usually placed during the second half of the Asian session (exceptions are possible).
Fig. 4 presents USDJPY H1:

Fig. 4. Asian session on USDJPY H1
Let's have a closer look on Asian session segments:

Fig. 5. Asian session segments, USDJPY H1
On Fig. 5, red price labels stand for market entry opportunities. All of them are set at the candle Open level. These are the moments when the described strategy suggests placing pending orders.
Now, let's analyze each segment separately. On all four segments, the Open time is 8.00 MSK (5.00 UTC).
- On the upper left segment, the candle starts opening at 113.521. The Low is 113.341, while the High is 113.553. Totally, we have 32 points from the Open price upwards and 180 points - downwards.
- On the upper right segment, the candle starts opening at 114.152. The Low is 114.109, the High (at the next hour) is 114.308. Totally, we have 156 points from the Open price upwards and 43 points - downwards.
- The bottom left segment opens at 113.601. The Low is 113.587, the High (after three hours) is 113.747. Totally, we have 146 points from the Open price upwards and 14 points - downwards.
- Finally, the lower right segment: Open is 113.192, Low is 112.957 and High is 113.193. Totally: up - 1 point, down - 235.
Let's show everything in a table for more clarity:
Table 1
| Segment # | Open | High | Low | Maximum points | Minimum points |
|---|---|---|---|---|---|
| 1 | 113.521 | 113.553 | 113.341 | 180 | 32 |
| 2 | 114.152 | 114.308 | 114.109 | 156 | 43 |
| 3 | 113.601 | 113.747 | 113.587 | 146 | 14 |
| 4 | 113.192 | 113.193 | 112.957 | 235 | 1 |
| Summary | --- | --- | --- | minimum 146 | maximum 43 |
As we can see in Table 1, the least of the maximum movements in one direction has comprised 146 points, while the strongest of the minimum ones — 43 points during all the four sessions. Let's round the maximum one down to 140 points and round the minimum one up to 45 points, accordingly.
Set two opposite pending orders of 50 points in all four cases. Set a stop loss to 100-110 points, while a take profit — to 50-80 points. The profit comprises 200-320 points, respectively. In other words, the take profit is triggered in all four cases.
Thus, we have received a fully working and efficient trading strategy. Now, we only have to turn it into a code, test on history and find out if it is profitable.
Coding the strategies
Bollinger Bands-based strategy
First, include the CTrade class to manage trades more conveniently. Next, we deal with incoming variables.
- The div_work variable is responsible for sharp price spikes: it limits the range, within which the signal can be located.
- The div_signal variable is responsible for signal distortion. The point of crossing the upper or lower indicator border is not considered a signal. Instead, it is given some reserve. In other words, the signal is triggered when the price goes beyond the border for the distance set in this variable. This allows sorting out a series of false signals.
- The work_alt variable is a flag that allows closing the current position and opening a new one when an opposite signal appears.
//+------------------------------------------------------------------+
//|                                        BollingerBandsForFlat.mq5 |
//|                                                          Aktiniy |
//|                                                             BBFF |
//+------------------------------------------------------------------+
#property copyright "Aktiniy"
#property link      "BBFF"
#property version   "1.01"
#include<Trade\Trade.mqh>
//--- input parameters
input char     time_h_start=22;       // Trading start time
input char     time_h_stop=3;         // Trading stop time
input int      bands_period=12;       // Bollinger Bands period
input int      bands_shift=0;         // Bollinger Bands shift
input double   bands_diviation=2;     // Bollinger Bands deviations
input double   div_work=3;            // Deviation from signal
input double   div_signal=5;          // Undervaluation of the main signal
input bool     work_alt=true;         // Work with a position in case of an opposite signal
input int      take_profit=50;        // Take Profit
input int      stop_loss=100;         // Stop Loss
//---
input bool     mon=true;              // Work on Monday
input bool     tue=false;             // Work on Tuesday
input bool     wen=true;              // Work on Wednesday
input bool     thu=true;              // Work on Thursday
input bool     fri=true;              // Work on Friday
//---
input long magic_number=65758473787389; // Magic number
input double order_volume=0.01;         // Lot size
input int order_deviation=100;          // Deviation by position opening
//--- Variable
MqlDateTime time_now_str;
datetime time_now_var;
CTrade trade;
int bb_handle;
double bb_base_line[3];
double bb_upper_line[3];
double bb_lower_line[3];
bool work_day=true;
The remaining incoming variables are commented enough in the code.
As for global variables, there are:
- two equivalent time variables (time_now_str, time_now_var) for convenience,
- followed by the class object for working with orders,
- indicator handle,
- three small arrays for the indicator data at the current time (bb_base_line[], bb_upper_line[], bb_lower_line[]).
- The work_day variable is responsible for issuing orders by days of week.
Next, there is a small code for initializing some parameters for working with the class:
//+------------------------------------------------------------------+
//| Expert initialization function                                   |
//+------------------------------------------------------------------+
int OnInit()
  {
//---
   trade.SetExpertMagicNumber(magic_number);
   trade.SetDeviationInPoints(order_deviation);
   trade.SetTypeFilling(ORDER_FILLING_FOK);
   trade.SetAsyncMode(false);
//---
   return(INIT_SUCCEEDED);
  }
Now consider the main code of interaction and signal reception.
First, we get the current time from the server, then use the switch operator to check if opening orders is allowed today and enter the data to the work_day variable.
I assumed that the EA would work during all sessions (not only the Asian one). In addition, it is possible that the time of the terminal is different on different servers. Therefore, we need to check the working time. There are two options here: either work during the period, or use the transition through the daily period separator. Enter the data to the 'work' flag.
If the working time and the selected day match, then the indicator handle is calculated and its data is copied to the previously declared array. Next, we should know buy and sell prices since they are used to calculate buy and sell signals. If there are no open positions, set the appropriate order in case of a signal.
//+------------------------------------------------------------------+
//| Expert tick function                                             |
//+------------------------------------------------------------------+
void OnTick()
  {
//---
   time_now_var=TimeCurrent(time_now_str);// current time
   bool work=false;

      switch(time_now_str.day_of_week)
     {
      case 1: if(mon==false){work_day=false;}
      else {work_day=true;}
      break;
      case 2: if(tue==false){work_day=false;}
      else {work_day=true;}
      break;
      case 3: if(wen==false){work_day=false;}
      else {work_day=true;}
      break;
      case 4: if(thu==false){work_day=false;}
      else {work_day=true;}
      break;
      case 5: if(fri==false){work_day=false;}
      else {work_day=true;}
      break;
     }

//--- check the working time
   if(time_h_start>time_h_stop)             // work with transition to the next day
     {
      if(time_now_str.hour>=time_h_start || time_now_str.hour<=time_h_stop)
        {
         work=true;
        }                                   // pass the flag enabling the work
     }
   else                                     // work during the day
     {
      if(time_now_str.hour>=time_h_start && time_now_str.hour<=time_h_stop)
        {
         work=true;
        }
     }                                     // pass the flag enabling the work

   int pos=PositionsTotal();

   if(work==true && work_day==true)        // work enabled
     {
      bb_handle=iBands(_Symbol,_Period,bands_period,bands_shift,bands_diviation,PRICE_CLOSE);         // find out the Bollinger Bands handle
      int i_bl=CopyBuffer(bb_handle,0,0,3,bb_base_line);
      int i_ul=CopyBuffer(bb_handle,1,0,3,bb_upper_line);
      int i_ll=CopyBuffer(bb_handle,2,0,3,bb_lower_line);
      if(i_bl==-1 || i_ul==-1 || i_ll==-1)
        {Alert("Error of copy iBands: base line=",i_bl,", upper band=",i_ul,", lower band=",i_ll);}   // check the copied data

      double price_ask=SymbolInfoDouble(_Symbol,SYMBOL_ASK);
      double price_bid=SymbolInfoDouble(_Symbol,SYMBOL_BID);

      if(pos<1)
        {
         if((price_ask-(div_signal*_Point))>=bb_upper_line[2]-(div_work*_Point) && (price_ask-(div_signal*_Point))<=bb_upper_line[2]+(div_work*_Point))// sell signal
           {
            trade.Sell(order_volume,_Symbol,price_bid,(price_bid+(stop_loss*_Point)),(price_bid-(take_profit*_Point)),"pos<1_sell");
           }
         if((price_bid+(div_signal*_Point))<=bb_lower_line[2]+(div_work*_Point) && (price_bid+(div_signal*_Point))>=bb_lower_line[2]-(div_work*_Point))// buy signal
           {
            trade.Buy(order_volume,_Symbol,price_ask,(price_ask-(stop_loss*_Point)),(price_ask+(take_profit*_Point)),"pos<1_buy");
           }
        }
      if(pos>0 && work_alt==true)
        {
         if(trade.RequestType()==ORDER_TYPE_BUY)                     // if there was a buy order before that
            if((price_ask-(div_signal*_Point))>=bb_upper_line[2]-(div_work*_Point) && (price_ask-(div_signal*_Point))<=bb_upper_line[2]+(div_work*_Point))// sell signal
              {
               trade.PositionClose(_Symbol,order_deviation);
               trade.Sell(order_volume,_Symbol,price_bid,(price_bid+(stop_loss*_Point)),(price_bid-(take_profit*_Point)),"pos>0_sell");
              }
         if(trade.RequestType()==ORDER_TYPE_SELL)                   // if there was a sell order before that
            if((price_bid+(div_signal*_Point))<=bb_lower_line[2]+(div_work*_Point) && (price_bid+(div_signal*_Point))>=bb_lower_line[2]-(div_work*_Point))// buy signal
              {
               trade.PositionClose(_Symbol,order_deviation);
               trade.Buy(order_volume,_Symbol,price_ask,(price_ask-(stop_loss*_Point)),(price_ask+(take_profit*_Point)),"pos>0_buy");
              }
        }
     }
   else
     {
      if(pos>0)
        {
         trade.PositionClose(_Symbol,order_deviation);
        }
     }
  }
//+------------------------------------------------------------------+
The last code element: close all orders if the night session is closed. This ends the EA's code.
Strategy based on a sharp volatility change
Here everything is extremely simple: orders are only set at a certain order_time. Orders are set at the order_div distance from the current price with a corresponding stop loss (order_sl) and take profit (order_tp). If none of the pending orders is triggered, this indicates a flat market movement, and orders are removed upon time_to_del expiration (in seconds).
Other inputs are the same as in the previous EA.
The added global variables are:
- work — enable one-time placing of orders only,
- work_del — enable removal of an opposite order if one of the orders is triggered,
- work_day — enable working during the current day.
Also, there are two results structures for receiving data and removing a pending order
//+------------------------------------------------------------------+
//|                                                TimeBuyOrSell.mq5 |
//|                                                          Aktiniy |
//|                                                             TBOS |
//+------------------------------------------------------------------+
#property copyright "Aktiniy"
#property link      "TBOS"
#property version   "1.01"
#include<Trade\Trade.mqh>
//--- input parameters
input int      order_time=0;                        // Order open time
input int      order_sl=200;                        // Stop Loss
input int      order_tp=180;                        // Take Profit
input int      order_div=120;                       // Deviations by placing orders from the current price
input int      time_to_del=10800;                   // Orders removal time
//---
input bool     mon=true;                            // Work on Monday
input bool     tue=false;                           // Work on Tuesday
input bool     wen=true;                            // Work on Wednesday
input bool     thu=true;                            // Work on Thursday
input bool     fri=true;                            // Work on Friday
//---
input long magic_number=65758473787389;             // Magic number
input double order_volume=0.01;                     // Lot size
input int order_deviation=100;                      // Deviation by position opening
//--- Variable
CTrade trade;
MqlDateTime time_now_str;
datetime time_now_var;
bool work=true;
bool work_del=true;
bool work_day=true;
//---
MqlTradeResult result_buy={0};
MqlTradeResult result_sell={0};
It is followed by a small code for initializing some parameters of working with the class identical to the previous one.
The beginning of the OnTick function is similar to the previous described EA. After getting the flag for working the current day, the check is performed on whether the current hour corresponds with it. If all is successful, calculate the parameters for opening orders (Take Profit, Stop Loss, Open price and time of removal in case of failure to trigger). Send the relevant trade requests to the server.
After placing the pending orders, the EA monitors the triggering of one of them and removes the extra one from the result structure (result_buy, result_sell) by its ticket.
//+------------------------------------------------------------------+
//| Expert tick function                                             |
//+------------------------------------------------------------------+
void OnTick()
  {
//---
   time_now_var=TimeCurrent(time_now_str);// current time

   switch(time_now_str.day_of_week)
     {
      case 1: if(mon==false){work_day=false;}
      else {work_day=true;}
      break;
      case 2: if(tue==false){work_day=false;}
      else {work_day=true;}
      break;
      case 3: if(wen==false){work_day=false;}
      else {work_day=true;}
      break;
      case 4: if(thu==false){work_day=false;}
      else {work_day=true;}
      break;
      case 5: if(fri==false){work_day=false;}
      else {work_day=true;}
      break;
     }

   if(time_now_str.hour==order_time && work==true && work_day==true)
     {
      double price_ask=SymbolInfoDouble(_Symbol,SYMBOL_ASK);
      double price_bid=SymbolInfoDouble(_Symbol,SYMBOL_BID);

      double div=order_div*_Point;
      double sl=order_sl*_Point;
      double tp=order_tp*_Point;

      double price_buy=price_ask+div;
      double price_sell=price_bid-div;

      double buy_sl=price_buy-sl;
      double buy_tp=price_buy+tp;
      double sell_sl=price_sell+sl;
      double sell_tp=price_sell-tp;

      datetime time_end=time_now_var+time_to_del;     //3600 seconds, one hour

      trade.BuyStop(order_volume,price_buy,_Symbol,buy_sl,buy_tp,ORDER_TIME_SPECIFIED,time_end,"BuyLimit");
      trade.Result(result_buy);

      trade.SellStop(order_volume,price_sell,_Symbol,sell_sl,sell_tp,ORDER_TIME_SPECIFIED,time_end,"SellLimit");
      trade.Result(result_sell);

      work=false;
     }

   if(PositionsTotal()>0 && work_del==true)
     {
      PositionSelect(_Symbol);
      long position_type=PositionGetInteger(POSITION_TYPE);
      if(position_type==POSITION_TYPE_SELL)
         trade.OrderDelete(result_buy.order);
      if(position_type==POSITION_TYPE_BUY)
         trade.OrderDelete(result_sell.order);

      work_del=false;
     }
   if(PositionsTotal()==0)
      work_del=true;

   if(time_now_str.hour!=order_time)
     {
      work=true;
     }

  }
//+------------------------------------------------------------------+
The code ends with the flag enabling placing orders due to exceeding the open time.
Testing and profitability
Bollinger Bands-based strategy
- Symbol: EURUSD
- Period: М30 (2017.01.01 - 2017.11.03)
- Broker: Halifax Investment Services Pty Ltd
- Currency: AUD
- Initial deposit: 100.00
- Leverage: 1:100
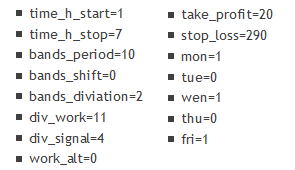
The following parameters have been revealed during the optimization:
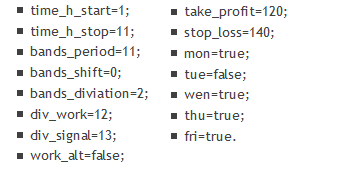
Let's describe them briefly: the work is performed at night time from 1:00 up to 11:00 (MSK), the indicator period is 11, the deviation from signal is 12, the main signal undervaluation is 13, Stop Loss=140 and Take Profit=120, working all days of the week, except Tuesday.
First, let's look at the results when testing on "OHLC on M1", Fig. 6 and 7:

Fig. 6. Bollinger Bands-based strategy test results by OHLC on M1
")
Fig. 7. Test results on the chart (Bollinger Bands by OHLC on M1)
Test results with the same parameters in the "Every tick based on real ticks" mode, Fig. 8 and 9:

Fig. 8. Bollinger Bands-based strategy test results in the "Every tick based on real ticks" mode
")
Fig. 9. Test results on the chart (Bollinger Bands in the "Every tick based on real ticks" mode)
As we can see, the profit is obtained in both cases: in the first one, it comprises 152%, while in the second — 48%, (due to history quality). In both tests, the drawdown is less than 25%. I believe, this is quite an interesting and notable result.
Previously, we have examined three session periods (Fig. 3) and described the strategy. Now, let's see the EA performance on the first two segments (Fig. 10 and 11):

Fig. 10. The EA results on the previously considered first period
Fig. 10 (the first period from Fig. 3) shows that the EA implements three entries. The first is unsuccessful and ends with a stop loss, but the next two (at the end of the Asian session and the beginning of the European one) are closed by take profit.

Fig. 11. The EA results on the previously considered second period
Fig. 11 (the second period from Fig. 3) shows that the EA performs two entries — at the end of the Asian session and the beginning of the European one. One of them turned out to be profitable, while the second one is loss-making. On the third period from Fig. 3, the EA did not enter the market. It was Tuesday, and according to the settings, the EA did not trade on this day.
Now let's see the strategy results on other major pairs:
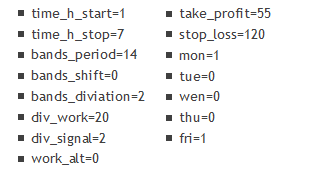
Symbol: AUDUSD
Period: M30 (2017.01.01 - 2017.11.07)
Inputs:
 test results")
 test results")
Fig. 13. AUDUSD M30 (BollingerBands) test results
Symbol: GBPUSD
Period: M30 (2017.01.01 - 2017.11.06)
Inputs:
 test results")
 test results")
Fig. 14. GBPUSD M30 (BollingerBands) test results
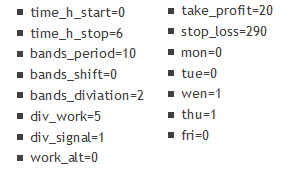
Symbol: NZDUSD
Period: M30 (2017.01.01 - 2017.11.07)
Inputs:
 test results")
 test results")
Fig. 15. NZDUSD M30 (BollingerBands) test results
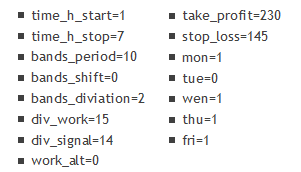
Symbol: USDCAD
Period: M30 (2017.01.01 - 2017.11.07)
Inputs:
 test results")
 test results")
Fig. 16. USDCAD M30 (BollingerBands) test results
Symbol: USDCHF
Period: M30 (2017.01.01 - 2017.11.07)
Inputs:
 test results")
 test results")
Fig. 17. USDCHF M30 (BollingerBands) test results
Accumulating all the testing data, we can come to the following conclusions.
- The most suitable pairs for working with this EA are EURUSD, NZDUSD and AUDUSD. According to the parameters, the signals are most useful on the previously named pairs in case Take Profit and Stop Loss differ no more than three times. Of course, the profit here is more progressive as well.
- A day of a week affects the profit. The behavior of currency pairs is different on different days of a week, although no stable patterns were detected: everything depends on the pair selected and the applied settings.
Strategy based on a sharp volatility change
The test parameters also change:
- Symbol: USDJPY
- Period: H1 (2017.01.01 - 2017.11.03)
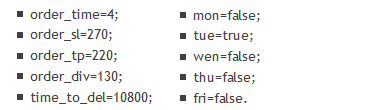
First, let's check the strategy outlined above. Here are its parameters:
- order_time=8;
- order_sl=140;
- order_tp=70;
- order_div=50;
- time_to_del=18000.
Here we raised the stop loss from 110 to 140 slightly increasing the profitability of the strategy. The test results are shown in Fig. 18 and 19, accordingly:

Fig.18. Sharp volatility change-based strategy test results, USDJPY H1

Fig. 19. Test results on USDJPY H1 chart
The chart shows that the strategy starts working approximately from the middle of the test. However, on the longer test period (approximately beginning with 2015), the strategy generally yields no profit. Also, according to these parameters, the entry is performed at 8:00 MSK, which means it affects the European session as well. This may be considered a morning trading.
Thus, the result is negative. Let's perform optimization on a wider range of dates and only during the "night time".
The test parameters also change:
- Symbol: USDJPY
- Period: H1 (2015.01.01 - 2017.11.03)
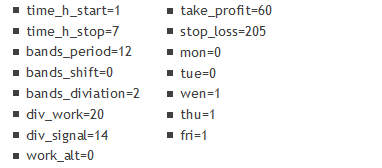
Test parameters:
Thus, the EA works only on Tuesday placing positions at 4:00 MSK (Asian session), stop loss and take profit are almost equal comprising 270 and 220 points respectively, orders are set at a distance of 130 from the entry price. The test results are shown in Fig. 20 and 21:
")
Fig. 20. Sharp volatility change-based strategy test results, USDJPY H1 (2015-2017)
 chart")
Fig. 21. Test results on USDJPY H1 (2015-2017) chart
The last test in the "Every tick based on real ticks" or "OHLC on M1" mode yields no significant changes in the results, therefore, the first variant is presented (Fig. 20 and 21).
Conclusion
We can conclude that it is quite possible to trade "at night" (Asian session) profitably with a small drawdown. The Bollinger Bands-based strategy has turned out to be particularly efficient during the tests both at night and during the entire day (this article represents only the Asian session results and the very beginning of the European one). I am going to improve this strategy, because I find it quite simple and promising.
As for the volatility change-based strategy, it has turned out to be quite simple, but much less efficient. Although, it can be used as a supplement to the first one. It has also been tested during the day (including the European session) showing moderately good performance. It is much more dependent on the days of week than the Bollinger Bands-based one. This has been revealed during the test over a long period of time. The EA has turned out to be redundant, and any possibility of its further modernization is minimal.
Files:
| # | Name | Type | Description |
|---|---|---|---|
| 1 | BollingerBandsForFlat_v1.01.mq5 | Expert Advisor | The EA focused on trading during the Asian session's flat movement. Based on Bollinger Bands signals |
| 2 | TimeBuyOrSell_v1.01.mq5 | Expert Advisor | The EA focused on trading during the most volatile time |
Translated from Russian by MetaQuotes Ltd.
Original article: https://www.mql5.com/ru/articles/4102
Warning: All rights to these materials are reserved by MetaQuotes Ltd. Copying or reprinting of these materials in whole or in part is prohibited.
This article was written by a user of the site and reflects their personal views. MetaQuotes Ltd is not responsible for the accuracy of the information presented, nor for any consequences resulting from the use of the solutions, strategies or recommendations described.

 Risk Evaluation in the Sequence of Deals with One Asset. Continued
 Momentum Pinball trading strategy
 Automatic Selection of Promising Signals
 Creating a custom news feed for MetaTrader 5
- Free trading apps
- Over 8,000 signals for copying
- Economic news for exploring financial markets
You agree to website policy and terms of use
Published article Night trading in the Asian session: how to stay in profit:
Author: Dmitriy Zabudskiy
Hello, Dmitriy!
Can you tell me why the Ask price is used when making a decision to sell in the Expert Advisor, but the Bid price is used when buying?
Hello, Dmitry!
Can you tell me why the Ask price is used when making a decision to sell in the Expert Advisor, but the Bid price is used when buying?
Hello!
At the beginning of development it was not planned to introduce divergence (div_signal and div_work), I wanted to limit myself (spread) as an earlier entry into the market, so as not to miss signals.
In this code, it is no longer of global nature and can be changed, as this parameter is corrected by optimising the trade.