
Integrating Computer Vision into Trading in MQL5 (Part 2): Extending the Architecture to 2D RGB Image Analysis

Introduction: When numbers come to life
In the first part of our research we showed how convolutional neural networks can analyze time series of currency quotes through one-dimensional filters. Now we are taking a qualitative leap: we are going to teach algorithms to perceive the market as a holistic landscape filled with textures, patterns, and hidden signals.
Transforming dry numerical series into images allows the algorithm to analyze the market from a completely new perspective. This is exactly how master traders think, seeing not just tables of data, but a living picture of the market, where every detail carries a significant signal. The algorithm rises above the one-dimensional representation, revealing structures and patterns that remain invisible in numerical series.
Data alchemy: From numbers to visual symphonies
Our 128x128-pixel digital canvas becomes the stage, on which the market drama unfolds. Market quote lines are transformed into multi-channel visual maps.
The red channel pulses with price data — the holy grail that traders chase. Green comes alive thanks to technical indicators: moving averages, MACD, Bollinger Bands – tools honed over decades. The blue channel breathes with oscillators — RSI, the Stochastic oscillator, and volatility measures that, like a pulse, reveal the market’s mood.
The code that creates this magic is deceptively simple, but behind it lies a power that could revolutionize our understanding of markets:
# Code snippet that converts data into an RGB image
for t in range(window_size):
    x = int(t / window_size * img_size[1])
    y = int((1 - img_data[j, t]) * img_size[0])
    if 0 <= y < img_size[0] and 0 <= x < img_size[1]:
        img[y, x, 0] = 1.0  # Red channel for price data
When data is converted into an image, amazing shapes emerge, like stars in the night sky. It is like seeing a face in a photograph instead of describing it with equations. Patterns that traders spend years learning to recognize — head and shoulders, double bottoms, flags — come alive before the algorithm, becoming as obvious as the dawn.
We have added candle patterns to make these images even richer. Bullish candles glow green, as a sign of hope for growth, while bearish candles glow red, as a warning. The wicks are drawn in halftones, like shadows, hinting at the struggle between buyers and sellers. This allows the model not only to capture general trends, but also notice subtle details such as "hammer", "engulfing", and "doji".
Here's how it is implemented in the code:
if close_y < open_y:  # Bullish candle
    for y in range(close_y, open_y):
        if 0 <= y < img_size[0] and 0 <= x < img_size[1]:
            img[y, x, 1] = 1.0  # Green
else:  # Bearish candle
    for y in range(open_y, close_y):
        if 0 <= y < img_size[0] and 0 <= x < img_size[1]:
            img[y, x, 0] = 1.0  # Red
These images are not just visualization. They are like heat maps, where the intensity of color reflects the energy of the market, and each candle is a small story about the battle between bulls and bears. This is a new language, in which the algorithm speaks to the market, and it sounds like poetry.
Neural architecture: An artificial trader with triple vision
Creating an artificial trader is like building a skyscraper, where each floor performs its own task, and together they create something grandiose. Our architecture consists of three parallel paths, each of which looks at the market from its own angle. The first path, with short convolutional filters, catches instantaneous flashes: level breakouts, reversals, sharp jumps. The second, with longer convolutional filters, looks at the big trends that, like rivers, shape market cycles. The third path monitors volatility and momentum, analyzing oscillators to understand whether the market is calm or ready to explode.
The code that embodies this idea looks like this:
local_path = Conv1D(64, 3, padding='same', activation='relu')(inputs[:,:,:,0])
trend_path = Conv1D(64, 7, padding='same', activation='relu')(inputs[:,:,:,1])
vol_path = Conv1D(64, 5, padding='same', activation='relu')(inputs[:,:,:,2])
These paths merge into a single whole, but before doing so, they pass through the attention mechanism — a technology that teaches the model to focus on the essentials, like a trader who, amid the noise of news and charts, sees only the key signal. Marcus du Sautoy, author of The Creativity Code, compares it to meditation: "The model learns to cut through the noise and see the essence". A single line of code makes this a reality:
attention_layer = Attention()([merged, merged])
But that is not all. We added a bidirectional LSTM layer that looks back and forth at the data, like a historian flipping through the pages of the past and future. This helps to capture complex patterns: protracted consolidations, hidden reversals, moments when the market freezes before a breakthrough. And then, the global feature aggregation, like a conductor, collects all the notes into a single symphony, creating a holistic view of the market.
The final touch is multi-task training. The model does not just decide whether the price will go up or down, it predicts how far the market will move. A legendary investor Peter Lynch claimed that knowing a stock is going to go up is one thing. But to predict that it will grow by exactly 8% is quite another thing. Our model does exactly this, like a chess player who sees not only the move, but the entire game.
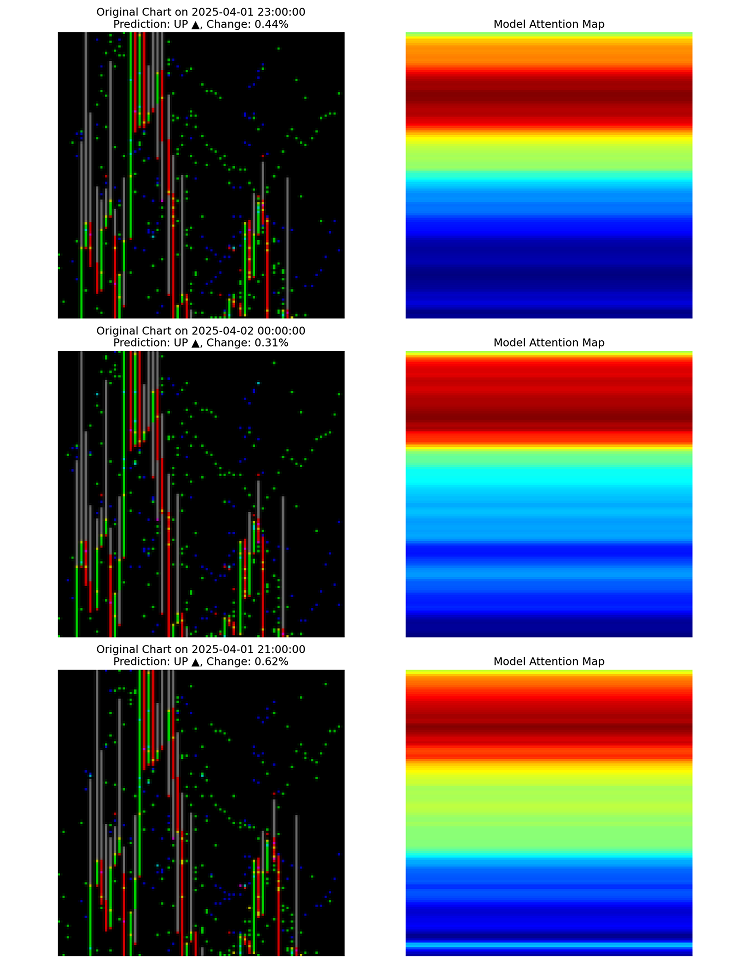
Through the keyhole: How the algorithm reveals its thoughts
The code that makes this possible is simple, but behind it lies a revolution:
attention = np.mean(np.abs(attention_maps[i]), axis=-1)
heatmap = cv2.applyColorMap(np.uint8(255 * attention_resized), cv2.COLORMAP_JET)
This visualization is the beginning of a new science: neural interpretation of markets. For the first time, we do not just get a forecast from a black box, but understand why it was made.
Another discovery is the specialization of neurons. By analyzing hidden-layer activations, we saw that some neurons "light up" only during sharp turns, others during smooth trends, and still others during the calm before the storm. It is like in the human brain, where different areas are responsible for vision or hearing.
The model created its own map of the market, classifying situations in a way no analyst had ever done. For example, it discovered unusual divergences between RSI and price, which experienced traders later confirmed as significant. This is not just an algorithm - it is a new way of seeing the market.
Transparency of decisions: When the machine explains itself
Our system does not just produce predictions — it explains how it arrived at them. We can draw a graph where the model's areas of attention are highlighted in red, showing what it is looking at. It is like peering into a trader’s mind as they mark key points on a chart. The code for this visualization looks like this:
def plot_prediction_with_attention(data, prediction, attention_weights):
    plt.plot(data.index, data['close'], label='Close price', color='black', linewidth=2)
    for i in range(len(data.index) - 1):
        plt.axvspan(data.index[i], data.index[i+1],
                   alpha=attention_weights[i] * 0.3, color='red')
Such images transform the model from a mystery into a partner. The trader sees not only that the market will go up, but also why: which indicators, which candles, which moments convinced the algorithm. The model glides through the data, producing predictions frame by frame, like a director filming a market movie. These are not just numbers - they are a story told in motion.
imageio.mimsave(gif_path, frames, duration=0.5)
Success stories: How a model changes the game
To understand how the model works in practice, imagine a trader named Ann who works for a small proprietary trading fund in Chicago. Ann relied on her experience and intuition for years, but the market became more and more complex, and the competition became increasingly tougher. Once she started using this model, her approach changed. Instead of spending hours analyzing charts, she now looks at the attention heat maps the model draws over EURUSD. These maps show where the market is ready to reverse, where the trend is gaining strength, and where a lull should be expected. But the model can also completely relieve Ann of stress by evolving into a trading robot.
Technical subtleties: How a model learns to see
One of the key steps was to use RobustScaler to normalize the data. Markets are chaotic. Shocks like sudden news can distort the picture. RobustScaler helps the model remain robust by ignoring these anomalies. How it works:
scaler = RobustScaler()
if window_data[indicator].std() != 0:
    img_data[j] = scaler.fit_transform(window_data[indicator].values.reshape(-1, 1)).flatten()
Another trick is to blur images using a Gaussian filter. This smooths out noise, helping the model focus on overall patterns rather than random spikes. It is like putting on glasses to see the entire forest behind single trees:
img = gaussian_filter1d(img, sigma=0.5, axis=0)
img = gaussian_filter1d(img, sigma=0.5, axis=1)
Training the model is a separate saga. We used callbacks to prevent it from overfitting, to save the best versions, and to adapt the learning rate. EarlyStopping stops the process if the model starts to learn the data "by heart", and ReduceLROnPlateau reduces the step when progress slows down. It is like teaching children to ride a bike: you support them until they ride on their own.
callbacks = [
    EarlyStopping(monitor='val_direction_accuracy', patience=15, restore_best_weights=True, verbose=1, mode='max'),
    ModelCheckpoint(filepath=os.path.join(checkpoint_dir, 'best_model.keras'), monitor='val_direction_accuracy', save_best_only=True, verbose=1),
    ReduceLROnPlateau(monitor='val_loss', factor=0.5, patience=7, min_lr=0.00001, verbose=1)
]
The results of the training graph are encouraging: the accuracy on the test set does not drop that much and remains consistently above 53% over a small number of training epochs:
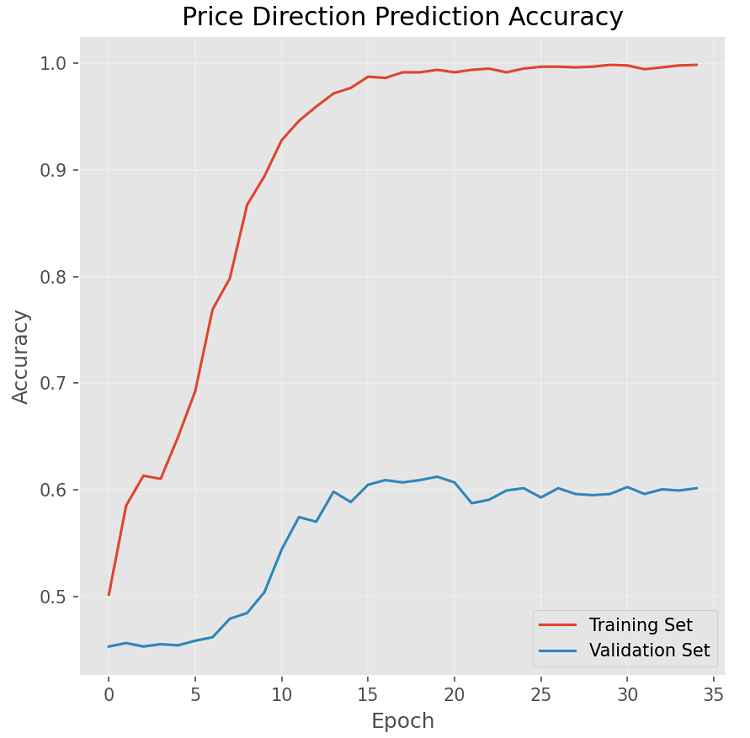
Our improved architecture is already showing promising results, but this is just the beginning.
Integration of fundamental data
The current model works exclusively with technical data. The next logical step is to integrate fundamental factors: economic indicators, news events, market sentiment. This can be achieved through multimodal training, where news context is transformed into vector representations and combined with technical data.
Time hierarchy and fractal structure of markets
Markets have a fractal nature: patterns appear across different timeframes with striking self-similarity. An architecture based on hierarchical handling of different timeframes (from minute to monthly charts) can reveal complex multi-level patterns.
Adaptive training and meta-learning
Markets are constantly evolving, requiring continuous adaptation of models. A promising direction is the development of a meta-learning system that automatically adjusts the architecture and parameters of a model depending on changing market conditions.
These details are not just code. This is the foundation on which the model learns to see the market deeper than any trader.
Looking to the future: New horizons
Our model is just the beginning, the first stroke on a larger canvas. Imagine that we add news and economic data. Transformers will turn Bloomberg headlines and Fed reports into vectors, which the model will blend with charts and indicators. A rate hike decision, or a sudden tweet from Elon Musk, will become part of the picture the algorithm sees. It is like giving a trader not just a chart, but the entire context of the world.
Markets are fractals, where patterns repeat on different timescales, from minutes to months. If we train the model to look at all timeframes simultaneously, it can find nested trends that elude even the best analysts. Imagine a model that sees a head and shoulders on the daily chart, and inside it a micro pattern on the five-minute chart. It is like seeing a galaxy and its stars at a glance.
What if the model improves itself? Meta-learning will allow it to adapt to changing market conditions, from calm to storm. If the market becomes volatile, it will adjust its parameters itself, like a captain steering the wheel in a storm. This is not a fantasy - it is the next step that is already looming on the horizon.
Transparency is another goal. We want traders to not just trust the model, but to learn from it. Deeper visualizations of attention and activation will reveal how the algorithm thinks and perhaps teach us to see the market differently. Imagine that the model identifies a pattern that no one has noticed before, and traders begin to call it a "neural cross" in its honor. It will not be just a tool, but a new way of thinking.
Translated from Russian by MetaQuotes Ltd.
Original article: https://www.mql5.com/ru/articles/18103
Warning: All rights to these materials are reserved by MetaQuotes Ltd. Copying or reprinting of these materials in whole or in part is prohibited.
This article was written by a user of the site and reflects their personal views. MetaQuotes Ltd is not responsible for the accuracy of the information presented, nor for any consequences resulting from the use of the solutions, strategies or recommendations described.

- Free trading apps
- Over 8,000 signals for copying
- Economic news for exploring financial markets
You agree to website policy and terms of use
Familiar style of presentation 🤣
Today, apparently, human authors have stopped formulating thoughts on their own.
IvanIvanych, can be used not only to suck "beautiful" epithets out of a finger, but also to analyse verbal patterns:
"The article demonstrates the characteristic features of an AI-created text, including high technical accuracy, structuredness, and tight publication deadlines. The sterile style of presentation and the use of complex concepts such as Attention mechanisms indicate the active use of neural networks to produce the material."
Good luck with mastering the budgets 🖖