
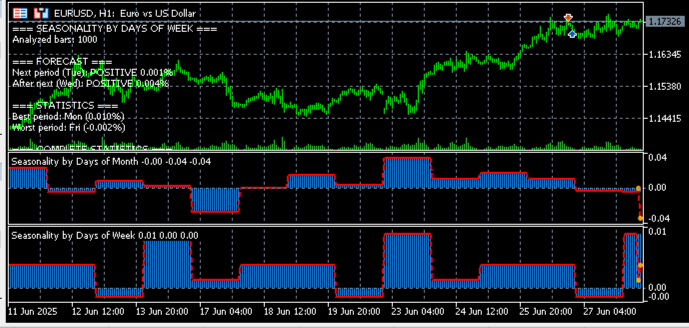
Seasonality Indicator by Hours, Days of the Week, and Days of the Month

Prices play a melody that repeats on certain days of the month, days of the week, or even hours of the day. These recurring rhythms, or seasonal patterns, can provide a trader with clues as to when the market is likely to rise and when it is likely to fall. Seasonality in financial markets is not just a curious phenomenon, but a tool that helps identify predictable moments in price chaos. For example, have you noticed that some currency pairs often rise on Mondays or fall at the end of the month? This is seasonality, and studying it can give traders an edge.
In this guide, we will create a seasonality indicator in MQL5 for the MetaTrader 5 platform. Our indicator will analyze historical price data to identify the average return for days of the month (1st to 31st), days of the week (Monday to Sunday), or hours of the day (0 to 23). The results will be displayed as a histogram in a separate chart window, with a forecast line connecting the seasonality values and dots highlighting the expected values on the following bars. In addition, the indicator will display text statistics with forecasts, best and worst periods. We will walk you through the development process step by step, explaining every part of the code so you can not only use the indicator but also adapt it to your own ideas. This guide takes you through both programming and financial analysis, where code becomes the bridge between data and trading decisions.
Why study seasonality?
Seasonality is like the hidden pulse of the market. It arises from many factors: trader behavior, economic events, even human psychology. For example, at the end of the month, large funds may close positions, causing predictable price movements. Or at certain times of the day, market activity increases due to the opening of trading sessions in London or New York. Our indicator will help you identify these patterns by turning chaotic data into clear charts and statistics. This is not magic but data analysis working in the trader’s favor.
The indicator we will create will be universal. It allows users to select the type of seasonality, set the number of bars to analyze, display returns as a percentage or absolute value, and enable or disable the forecast on the chart. Flexibility is the key to making the indicator a useful tool for different markets and timeframes, whether it is the daily EURUSD chart or the hourly gold chart.
Defining the structure of the indicator
Creating an indicator begins with understanding how it will look and work. We want it to be displayed in a separate window below the price chart so as not to clutter the main space. We use three elements for visualization: a histogram that shows the average return for each period, a forecast line that connects the seasonality values and the forecast data, and forecast points that highlight the expected values on the next two bars. Each element will be associated with a data buffer - an array that stores the values to be drawn. We will also need global variables to store seasonality data and period labels, as well as inputs so that the user can customize the indicator.
//+------------------------------------------------------------------+
//|                                         SeasonalityIndicator.mq5 |
//|                                  Copyright 2025, MetaQuotes Ltd. |
//|                                             https://www.mql5.com |
//+------------------------------------------------------------------+
#property copyright "Copyright 2025, MetaQuotes Ltd."
#property link      "https://www.mql5.com"
#property version   "1.00"
#property indicator_separate_window
#property indicator_buffers 3
#property indicator_plots   3

//--- plot Seasonality
#property indicator_label1  "Seasonality"
#property indicator_type1   DRAW_HISTOGRAM
#property indicator_color1  clrDodgerBlue
#property indicator_style1  STYLE_SOLID
#property indicator_width1  2

//--- plot Forecast Line
#property indicator_label2  "Forecast"
#property indicator_type2   DRAW_LINE
#property indicator_color2  clrRed
#property indicator_style2  STYLE_DASH
#property indicator_width2  2

//--- plot Forecast Points
#property indicator_label3  "Forecast Points"
#property indicator_type3   DRAW_ARROW
#property indicator_color3  clrOrange
#property indicator_width3  3
In this code, we set basic information about the indicator: copyright, link to the MetaQuotes website, and version. The #property indicator_separate_window directive specifies that the indicator will be in a separate window. We define three buffers and three plots. The DRAW_HISTOGRAM histogram is colored blue, the DRAW_LINE forecast line is colored red, and the DRAW_ARROW forecast points are colored orange with a width of three pixels. These settings define the visual style that will make the indicator clear and attractive.
Set up inputs
To make the indicator flexible, we add inputs that the user can change in the MetaTrader 5 settings window. The parameter for selecting the seasonality type allows us to analyze days of the month, days of the week, or hours of the day. The number of bars to analyze determines how deep into history we can look. It is possible to display returns as a percentage or absolute value, as well as to show only positive seasonality values. The option to enable the forecast on the chart and customize the colors of the line and forecast points makes the indicator even more customizable.
//--- Input parameters
enum ENUM_SEASONALITY_TYPE
{
   SEASONALITY_DAYS_OF_MONTH = 0,  // Days of the month (1-31)
   SEASONALITY_DAYS_OF_WEEK = 1,   // Days of the week (Mon-Sun)
   SEASONALITY_HOURS = 2           // Hours (0-23)
};

input ENUM_SEASONALITY_TYPE SeasonalityType = SEASONALITY_DAYS_OF_MONTH; // Seasonality type
input int BarsToAnalyze = 1000;                                          // Number of bars to analyze
input bool ShowPercentage = true;                                        // Show as a percentage
input bool ShowPositiveOnly = false;                                     // Show only positive values
input bool ShowForecastOnChart = true;                                   // Show forecast on chart
input color ForecastColor = clrRed;                                      // Forecast line color
input color ForecastPointsColor = clrOrange;                             // Color of forecast points
The ENUM_SEASONALITY_TYPE enumeration defines three seasonality options. By default, analysis by days of the month is selected. The BarsToAnalyze parameter is set to 1000 bars, which corresponds to approximately four years of data on a daily chart. The ShowPercentage option is enabled by default to display returns as a percentage, which is more intuitive. The ShowPositiveOnly and ShowForecastOnChart parameters provide additional flexibility, and the colors can be changed through the MetaTrader interface.
Defining buffers and variables
To store data, the indicator uses three buffers: one for the histogram, the second for the forecast line, and the third for forecast points. Global variables are also needed: an array for storing the average return by period, an array for period labels (for example, "Mon" or "1"), and a variable for the number of periods, which depends on the type of seasonality (31 for days of the month, 7 for days of the week, 24 for hours).
//--- Indicator buffers
double SeasonalityBuffer[];
double ForecastLineBuffer[];
double ForecastPointsBuffer[];

//--- Global variables
double seasonality_data[];
string period_labels[];
int periods_count;
The buffers will contain the data to be rendered, and the seasonality_data and period_labels variables will help store and display the analysis results. The periods_count variable determines how many periods are analyzed and is set depending on the type of seasonality.
Indicator initialization
The OnInit function is executed when the indicator starts and is responsible for the initial setup. It binds the buffers to the indicator plots, sets the arrow style for forecast points, and sets colors from user parameters. Depending on the seasonality type, labels are created for the periods, and the array for storing seasonality data is initialized to zeros. The display precision is adjusted depending on whether percentages or absolute values are selected.
int OnInit()
{
   SetIndexBuffer(0, SeasonalityBuffer, INDICATOR_DATA);
   SetIndexBuffer(1, ForecastLineBuffer, INDICATOR_DATA);
   SetIndexBuffer(2, ForecastPointsBuffer, INDICATOR_DATA);

   PlotIndexSetInteger(2, PLOT_ARROW, 159);

   PlotIndexSetInteger(1, PLOT_LINE_COLOR, ForecastColor);
   PlotIndexSetInteger(2, PLOT_LINE_COLOR, ForecastPointsColor);

   switch(SeasonalityType)
   {
      case SEASONALITY_DAYS_OF_MONTH:
         periods_count = 31;
         ArrayResize(period_labels, periods_count);
         for(int i = 0; i < periods_count; i++)
            period_labels[i] = IntegerToString(i + 1);
         IndicatorSetString(INDICATOR_SHORTNAME, "Seasonality by day of the month");
         break;

      case SEASONALITY_DAYS_OF_WEEK:
         periods_count = 7;
         ArrayResize(period_labels, periods_count);
         period_labels[0] = "Mon";
         period_labels[1] = "Tue";
         period_labels[2] = "Wed";
         period_labels[3] = "Thu";
         period_labels[4] = "Fri";
         period_labels[5] = "Sat";
         period_labels[6] = "Sun";
         IndicatorSetString(INDICATOR_SHORTNAME, "Seasonality by day of the week");
         break;

      case SEASONALITY_HOURS:
         periods_count = 24;
         ArrayResize(period_labels, periods_count);
         for(int i = 0; i < periods_count; i++)
            period_labels[i] = IntegerToString(i) + ":00";
         IndicatorSetString(INDICATOR_SHORTNAME, "Seasonality by hours");
         break;
   }

   ArrayResize(seasonality_data, periods_count);
   ArrayInitialize(seasonality_data, 0.0);

   IndicatorSetInteger(INDICATOR_DIGITS, ShowPercentage ? 2 : _Digits);

   return(INIT_SUCCEEDED);
}
This function sets the basis for the indicator operation. For example, for days of the week, an array of labels is created from "Mon" to "Sun", and for hours - from "0:00" to "23:00". The indicator name changes so that the user immediately understands which type of seasonality is selected. This makes the indicator intuitive.
Calculation of seasonality
The main calculations are performed in the OnCalculate function. It analyzes historical price data, calculates the average return for each period, and fills the buffers for rendering. First, we check whether there are enough bars on the chart. Then auxiliary arrays are created to sum the returns and count the bars in each period.
For each bar, the return is calculated as the ratio of the difference in closing prices to the current closing price. The GetPeriodIndex function determines which period the bar belongs to, and the data is written to arrays. After this, the average return is calculated, which, if necessary, is converted into a percentage or reset to zero for negative values. The buffers are filled with data, and a separate function is called for the forecast.
int OnCalculate(const int rates_total,
                const int prev_calculated,
                const datetime &time[],
                const double &open[],
                const double &high[],
                const double &low[],
                const double &close[],
                const long &tick_volume[],
                const long &volume[],
                const int &spread[])
{
   if(rates_total < BarsToAnalyze + 1)
      return(0);

   ArrayInitialize(seasonality_data, 0.0);

   double period_returns[];
   int period_counts[];
   ArrayResize(period_returns, periods_count);
   ArrayResize(period_counts, periods_count);
   ArrayInitialize(period_returns, 0.0);
   ArrayInitialize(period_counts, 0);

   int start_pos = MathMax(0, rates_total - BarsToAnalyze - 1);

   for(int i = start_pos; i < rates_total - 1; i++)
   {
      double return_value = 0.0;
      if(close[i] != 0)
         return_value = (close[i+1] - close[i]) / close[i];

      int period_index = GetPeriodIndex(time[i]);

      if(period_index >= 0 && period_index < periods_count)
      {
         period_returns[period_index] += return_value;
         period_counts[period_index]++;
      }
   }

   for(int i = 0; i < periods_count; i++)
   {
      if(period_counts[i] > 0)
      {
         seasonality_data[i] = period_returns[i] / period_counts[i];
         if(ShowPercentage)
            seasonality_data[i] *= 100.0;
         if(ShowPositiveOnly && seasonality_data[i] < 0)
            seasonality_data[i] = 0.0;
      }
   }

   for(int i = 0; i < rates_total; i++)
   {
      int period_index = GetPeriodIndex(time[i]);
      if(period_index >= 0 && period_index < periods_count)
      {
         SeasonalityBuffer[i] = seasonality_data[period_index];
         ForecastLineBuffer[i] = seasonality_data[period_index];
      }
      else
      {
         SeasonalityBuffer[i] = 0.0;
         ForecastLineBuffer[i] = 0.0;
      }
      ForecastPointsBuffer[i] = EMPTY_VALUE;
   }

   if(ShowForecastOnChart)
      DrawForecastOnChart(rates_total, time);

   return(rates_total);
}
This code is the heart of the indicator. It turns raw price data into meaningful patterns. Imagine you are analyzing a daily chart of a currency pair. For each day of the week, the indicator calculates how much the price has changed and finds the average value. If you see that the market falls by an average of 0.05% on Fridays, this could be a signal for a trading strategy.
Definition of the period
To understand which period each bar belongs to, we create the GetPeriodIndex function. It converts bar time into a period index depending on the type of seasonality. For days of the month, it takes the day number and subtracts one to get an index from 0 to 30. For days of the week, it converts the weekday value (where Sunday is 0 and Monday is 1) to a day of the week order where Monday is 0 and Sunday is 6. For hours, the hour value from 0 to 23 is simply returned.
int GetPeriodIndex(datetime bar_time)
{
   MqlDateTime dt;
   TimeToStruct(bar_time, dt);

   switch(SeasonalityType)
   {
      case SEASONALITY_DAYS_OF_MONTH:
         return(dt.day - 1);

      case SEASONALITY_DAYS_OF_WEEK:
         return(dt.day_of_week == 0 ? 6 : dt.day_of_week - 1);

      case SEASONALITY_HOURS:
         return(dt.hour);
   }

   return(-1);
}
This function is like a compass that helps the indicator understand which "box" to assign the bar data to. Without it, we would not be able to associate the price with a specific day or hour.
Drawing the forecast
The forecast is what makes the indicator not only analytical, but also practically useful. The DrawForecastOnChart function draws the expected seasonality values on the last two bars of the chart. It determines the current period and the next two periods using the GetNextPeriod function. Seasonality values for these periods are written to the forecast line and point buffers. To make the forecast line look smooth, the value of the current period is written to the buffer for the penultimate bar.
void DrawForecastOnChart(int rates_total, const datetime &time[])
{
   if(rates_total < 3)
      return;

   datetime current_time = time[rates_total - 1];
   int current_period = GetPeriodIndex(current_time);
   int next_period1 = GetNextPeriod(current_period);
   int next_period2 = GetNextPeriod(next_period1);

   int forecast_pos1 = rates_total - 2;
   int forecast_pos2 = rates_total - 1;

   if(next_period1 >= 0 && next_period1 < periods_count)
   {
      ForecastLineBuffer[forecast_pos1] = seasonality_data[next_period1];
      ForecastPointsBuffer[forecast_pos1] = seasonality_data[next_period1];
   }

   if(next_period2 >= 0 && next_period2 < periods_count)
   {
      ForecastLineBuffer[forecast_pos2] = seasonality_data[next_period2];
      ForecastPointsBuffer[forecast_pos2] = seasonality_data[next_period2];
   }

   if(rates_total >= 3)
   {
      int current_pos = rates_total - 3;
      int current_period_idx = GetPeriodIndex(time[current_pos]);

      if(current_period_idx >= 0 && current_period_idx < periods_count)
      {
         double current_value = seasonality_data[current_period_idx];
         double next_value = (next_period1 >= 0) ? seasonality_data[next_period1] : current_value;

         ForecastLineBuffer[current_pos] = current_value;
         if(forecast_pos1 < rates_total)
            ForecastLineBuffer[forecast_pos1] = next_value;
      }
   }
}
A forecast is like a look into the future: the indicator tells you what to expect based on historical data. If, for example, Tuesdays typically return +0.07%, the indicator will show this on the chart, helping the trader prepare.
Calculating the next period
The GetNextPeriod function determines which period follows the current one. It uses modular arithmetic to provide a cyclic transition: after the 31st day of the month comes the 1st, after Sunday comes Monday, after 23:00 comes 0:00.
int GetNextPeriod(int current_period)
{
   if(current_period < 0)
      return(-1);

   switch(SeasonalityType)
   {
      case SEASONALITY_DAYS_OF_MONTH:
         return((current_period + 1) % 31);

      case SEASONALITY_DAYS_OF_WEEK:
         return((current_period + 1) % 7);

      case SEASONALITY_HOURS:
         return((current_period + 1)rate_total % 24);
   }

   return(-1);
}
This function ensures that the forecast always looks at the correct future periods, preserving the cyclical time logic. It acts as a precise market calendar, ensuring that the indicator moves correctly from one period to the next, whether it be the changing of the days of the month, days of the week, or hours. Think of the market as a giant clock, where every tick counts not only time but also potential price movements. After the 31st day of the month, the function smoothly returns us to the 1st day, after Sunday it moves to Monday, and after 23:00 - to 0:00. This cyclical approach reflects the real time structure of financial markets, allowing the indicator to predict which periods may be significant for a trader.
Displaying statistics
To enable traders to instantly understand the analysis results, the indicator displays detailed statistics directly on the chart. The ShowStatistics function creates a text message that, like a storyteller, turns dry numbers into a fascinating story of market patterns.
It begins with a title that changes depending on the type of seasonality chosen — whether it is analysis by day of the month, day of the week, or hour of the day. The number of bars analyzed is then indicated, giving the trader an idea of the depth of historical data underlying the calculations. Next, the forecast obtained from the GetForecast function is added, which predicts how the market might perform over the next two periods based on historical trends. After this, the function carefully examines the seasonality_data array, finding the periods with the highest and lowest returns. These periods are labeled as best and worst, and their values are displayed to three decimal places so that the trader can assess their significance.
The message concludes with full statistics, where for each period its label is shown — for example, "Mon" or "15" — and the average return. The text appears in the upper-right corner of the chart as a compact analytical summary of market rhythms, making them understandable and useful for making trading decisions.
Conclusion
Seasonality in financial markets is not a mystical phenomenon, but a mathematically proven pattern that can become a powerful tool in a trader's arsenal. The indicator we created transforms chaotic price movements into understandable patterns, revealing hidden market rhythms by day of the month, day of the week, or trading session hour.
With flexible parameter settings, visual display of results in the form of a histogram with a forecast, and detailed statistics, this tool allows traders to not only analyze historical data but also make informed assumptions about future price movements. The integration of forecast elements makes the indicator practically applicable for developing trading strategies.
The indicator code is easily adapted to various assets and timeframes, and a step-by-step explanation of each function allows us to modify the algorithm to suit our own trading ideas. Ultimately, this indicator is the bridge between complex statistical calculations and concrete trading decisions, turning data into knowledge and knowledge into potential profit.
Translated from Russian by MetaQuotes Ltd.
Original article: https://www.mql5.com/ru/articles/18672
Warning: All rights to these materials are reserved by MetaQuotes Ltd. Copying or reprinting of these materials in whole or in part is prohibited.
This article was written by a user of the site and reflects their personal views. MetaQuotes Ltd is not responsible for the accuracy of the information presented, nor for any consequences resulting from the use of the solutions, strategies or recommendations described.


- Free trading apps
- Over 8,000 signals for copying
- Economic news for exploring financial markets
You agree to website policy and terms of use