Discussing the article: "From Basic to Intermediate: Indicator (III)"
Dear all.
I am trying to build Custom indicator base on iBand.
After alot of searching I decide to Post here may be someone can help me.
Here is the full indicator.
Problem 1 is:
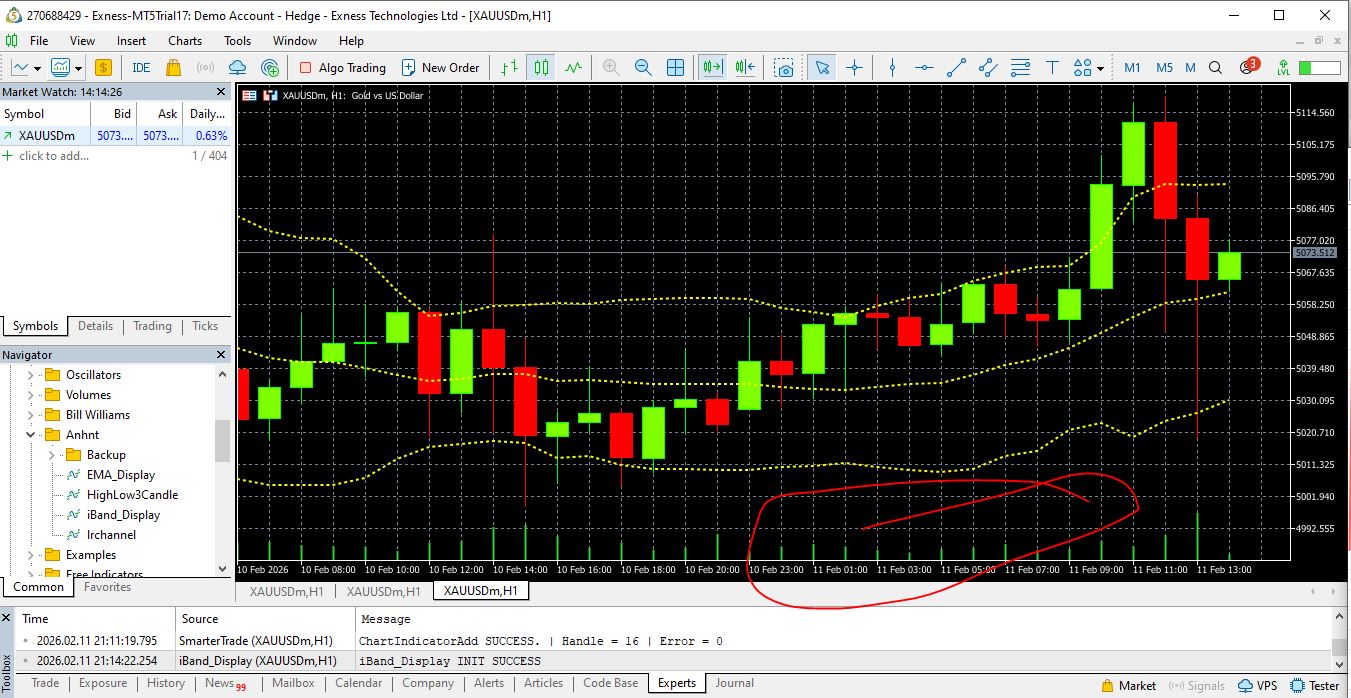
You can see in picture attach, I don't know why I have green under chart.
I am trying to build Custom indicator base on iBand.
After alot of searching I decide to Post here may be someone can help me.
Here is the full indicator.
//This is MQL5\Indicators\Anhnt\iBand_Display.mq5 #property indicator_chart_window #property indicator_buffers 3 #property indicator_plots 3 //--- plot Middle #property indicator_label1 "Middle" #property indicator_type1 DRAW_LINE //--- plot Upper #property indicator_label2 "Upper" #property indicator_type2 DRAW_LINE //--- plot Lower #property indicator_label3 "Lower" #property indicator_type3 DRAW_LINE //================================================== // Input parameters //================================================== input int InpBBPeriod = 14; input ENUM_APPLIED_PRICE inp_Applied_Price = PRICE_MEDIAN; input double InpBBDeviation = 2.0; input int InpBBShift = 0; input color InpMiddleColor = clrYellow; input color InpUpperColor = clrYellow; input color InpLowerColor = clrYellow; input int InpMiddleWidth = 2; input int InpUpperWidth = 2; input int InpLowerWidth = 2; input bool inp_BB_Show_Upper = true; input bool inp_BB_Show_Middle = true; input bool inp_BB_Show_Lower = true; input ENUM_LINE_STYLE InpMiddleStyle = STYLE_DOT; input ENUM_LINE_STYLE InpUpperStyle = STYLE_DOT; input ENUM_LINE_STYLE InpLowerStyle = STYLE_DOT; //================================================== #include <Anhnt/Configuration/NamingConfiguration.mqh> //================================================== // Indicator buffers //================================================== double MiddleBuffer[]; double UpperBuffer[]; double LowerBuffer[]; //================================================== // Global variables //================================================== int g_bb_handle = INVALID_HANDLE; //https://www.mql5.com/en/docs/indicators/ibands //--- we will keep the number of values in the Bollinger Bands indicator //+------------------------------------------------------------------+ int OnInit() { //================================================== // Set buffers //================================================== SetIndexBuffer(BASE_LINE, MiddleBuffer, INDICATOR_DATA); SetIndexBuffer(UPPER_BAND, UpperBuffer, INDICATOR_DATA); SetIndexBuffer(LOWER_BAND, LowerBuffer, INDICATOR_DATA); ArraySetAsSeries(MiddleBuffer, true); ArraySetAsSeries(UpperBuffer, true); ArraySetAsSeries(LowerBuffer, true); //================================================== // Apply INPUT values to plots (runtime-safe way) //================================================== PlotIndexSetInteger(BASE_LINE, PLOT_LINE_COLOR, InpMiddleColor); PlotIndexSetInteger(UPPER_BAND, PLOT_LINE_COLOR, InpUpperColor); PlotIndexSetInteger(LOWER_BAND, PLOT_LINE_COLOR, InpLowerColor); PlotIndexSetInteger(BASE_LINE, PLOT_LINE_STYLE, InpMiddleStyle); PlotIndexSetInteger(UPPER_BAND, PLOT_LINE_STYLE, InpUpperStyle); PlotIndexSetInteger(LOWER_BAND, PLOT_LINE_STYLE, InpLowerStyle); PlotIndexSetInteger(BASE_LINE, PLOT_LINE_WIDTH, InpMiddleWidth); PlotIndexSetInteger(UPPER_BAND, PLOT_LINE_WIDTH, InpUpperWidth); PlotIndexSetInteger(LOWER_BAND, PLOT_LINE_WIDTH, InpLowerWidth); PlotIndexSetInteger( BASE_LINE, PLOT_DRAW_TYPE, inp_BB_Show_Middle ? DRAW_LINE : DRAW_NONE ); PlotIndexSetInteger( UPPER_BAND, PLOT_DRAW_TYPE, inp_BB_Show_Upper ? DRAW_LINE : DRAW_NONE ); PlotIndexSetInteger( LOWER_BAND, PLOT_DRAW_TYPE, inp_BB_Show_Lower ? DRAW_LINE : DRAW_NONE ); string name = SMT_PREFIX + SMT_BB_NAME + "(" + (string)InpBBPeriod + "," + DoubleToString(InpBBDeviation, 1) + ")"; IndicatorSetString(INDICATOR_SHORTNAME, name); //================================================== // Create iBands handle //================================================== g_bb_handle = iBands( _Symbol, _Period, InpBBPeriod, InpBBShift, InpBBDeviation, inp_Applied_Price ); if(g_bb_handle == INVALID_HANDLE) { Print("iBand_Display INIT FAILED. Unable to create iBands handle. GetLastError = ", GetLastError()); return INIT_FAILED; } Print("iBand_Display INIT SUCCESS"); return INIT_SUCCEEDED; } //+------------------------------------------------------------------+ int OnCalculate( const int rates_total, const int prev_calculated, const datetime &time[], const double &open[], const double &high[], const double &low[], const double &close[], const long &tick_volume[], const long &volume[], const int &spread[] ) { //https://www.mql5.com/en/docs/indicators/ibands&nbsp; //--- wait until iBands is ready int calculated = BarsCalculated(g_bb_handle); if(calculated <= InpBBPeriod) return 0; // Print("DEBUG from OnCalculate After Waiting BarsCalculated | Symbol=", _Symbol, // " | Period=", _Period, // " | BarsCalculated(iBands)=", calculated); //--- This block is executed when the indicator is initially attached to a chart if(prev_calculated == 0) { ArrayInitialize(MiddleBuffer, EMPTY_VALUE); ArrayInitialize(UpperBuffer, EMPTY_VALUE); ArrayInitialize(LowerBuffer, EMPTY_VALUE); int to_copy = MathMin(calculated, rates_total); // Copy all available data at once CopyBuffer(g_bb_handle, BASE_LINE, 0, to_copy, MiddleBuffer); CopyBuffer(g_bb_handle, UPPER_BAND, 0, to_copy, UpperBuffer); CopyBuffer(g_bb_handle, LOWER_BAND, 0, to_copy, LowerBuffer); // Print("DEBUG from OnCalculate First Initial | Symbol=", _Symbol, // " | Period=", _Period, // " | BarsCalculated(iBands)=", calculated); return rates_total; } //--- This block is executed on every new bar open if(prev_calculated != rates_total && prev_calculated != 0) { //================================================== // NEXT RUNS: // Only update the newest bar (index 0). // Do NOT shift arrays manually (series handles it). //================================================== double tmp[1]; if(CopyBuffer(g_bb_handle, BASE_LINE, 0, 1, tmp) > 0) MiddleBuffer[0] = tmp[0]; if(CopyBuffer(g_bb_handle, UPPER_BAND, 0, 1, tmp) > 0) UpperBuffer[0] = tmp[0]; if(CopyBuffer(g_bb_handle, LOWER_BAND, 0, 1, tmp) > 0) LowerBuffer[0] = tmp[0]; return rates_total; } return rates_total; } //+------------------------------------------------------------------+ bool FillArraysFromBuffers( double &base_values [], // MiddleBuffer double &upper_values [], // UpperBuffer double &lower_values [], // LowerBuffer int shift, // shift = 0 → realtime int ind_handle, int amount ) { // NOTE: // Currently not used. // Kept for future helper / EA logic as planned. ResetLastError(); if(CopyBuffer(ind_handle, BASE_LINE, -shift, amount, base_values) < 0) return false; if(CopyBuffer(ind_handle, UPPER_BAND, -shift, amount, upper_values) < 0) return false; if(CopyBuffer(ind_handle, LOWER_BAND, -shift, amount, lower_values) < 0) return false; return true; }Very easy I just want to enable user to show or hide individual line such as BASE_LINE,UPPER_BAND,LOWER_BAND and Custom color only.
Problem 1 is:
You can see in picture attach, I don't know why I have green under chart.
Files:
Problem_1.jpg
217 kb
Nguyen Tuấn Anh # :
Caros.
Estou tentando criar um indicador personalizado baseado no iBand.
Depois de muita pesquisa, decidi postar aqui, talvez alguém possa me ajudar.
Aqui está o indicador completo. Muito simples, eu só quero permitir que o usuário mostre ou oculte linhas individuais, como BASE_LINE, UPPER_BAND, LOWER_BAND e apenas a cor personalizada.
O problema 1 é:
Como você pode ver na imagem em anexo, não sei por que há uma área verde embaixo do gráfico.
These green lines are the volume indicator. To disable this, you must open the chart properties and turn off the volume indicator. Or simply set the volume color to CL_NONE, so these green lines will disappear.
Caros.
Estou tentando criar um indicador personalizado baseado no iBand.
Depois de muita pesquisa, decidi postar aqui, talvez alguém possa me ajudar.
Aqui está o indicador completo. Muito simples, eu só quero permitir que o usuário mostre ou oculte linhas individuais, como BASE_LINE, UPPER_BAND, LOWER_BAND e apenas a cor personalizada.
O problema 1 é:
Como você pode ver na imagem em anexo, não sei por que há uma área verde embaixo do gráfico.
You are missing trading opportunities:
- Free trading apps
- Over 8,000 signals for copying
- Economic news for exploring financial markets
Registration
Log in
You agree to website policy and terms of use
If you do not have an account, please register
Check out the new article: From Basic to Intermediate: Indicator (III).
In the previous article "From Beginner to Intermediate: Indicator (II)," we learned a great deal, as it demonstrated how to implement a moving average in a very simple, practical, and fully functional way. However, what was shown can be considered only a brief introduction to the world of MQL5 programming, since the material is quite basic, simple, and straightforward. But we can do much more.
So, make an effort to understand the concepts presented here. Don't just copy the code, and don't think that if you can't do it, no one else can either. Understanding the concept is more important than understanding the code itself, as the code can vary depending on who writes it, while the concept remains constant. We will start with something very simple, because what you will see can become very complex if we suddenly apply certain functionalities.
Author: CODE X