
Idleness is the Stimulus to Progress, or How to Work with Graphics Interacively
Introduction
On an english-speaking forum I've met an interesting description of Fibo levels interpretation. The main idea is the correction of impulse moving is approaching to the region between 38,2 и 61,8 %. As I've watched the video uploaded there and as I've tried to draw the Fibo levels on the charts by myself, I came to using this tool in my own practice.
I won't rest upon the advantages and disadvantages of this system. I want to tell another thing here. As I'm naturally lazy (supposing that I'm not alone in this) and all this endless drawings and redrawings of fibs for searching that reverse zone on a chart have bored me enough, I decided to put a part of working on the MQL4.
The main problem that I need to solve is the automatic displaying of the zones with some colors on the price chart from the hand-drawn fibs. It is not a secret that the color displaying of the objects improves their vivid perception. Agree, that it is much more easier to perceive an object on a chart, than to analyze a variety of lines with a numbers specified on them all the time.
Processing of Coordinates of Graphical Objects
I actually think that interactivity should be supplied during working with a chart. We need to get the program drawing of the icons or even the additional graphical drawings for the drawings made by a trader, and also we need the accompanying sound in cases of trend line crossing, for example.
It is necessary to note the advantages of the manual drawing:
- This allows the trader him/herself to assign a reference point of objects drawing on the chart.
- A sufficiently enough code entries are saved, so the computer's processor loading too.
- It is not necessary to program an initial logic of drawing an object on a chart. By the way, it is not so easy to reach the necessary logic programmatically. Take a look, how many "ZigZag" indicators there are, for example.
Here I want to show how to implement an indicator of intersection of a hand-drawn trend line.
First of all, let's draw a trend line on a chart. Then find this line in the list of objects. This line is called, for example, so: Trendline 29344. Trendline is the description of the line itself, and 29344 is the number that is assigned to it by the MetaTrader 4 Client Terminal.
Let's rename the Trendline into the TrDup, it will be the line of the up-trend.
Then we repeat the same steps of creating another trend line and create the TrDdown trend line using which we will be showing the down-trend.
(the 1_01_Tr_Alert indicator is adjusted on cooperation with these lines exactly, the same names are used in the indicator of Demark trend lines drawing TL_by_Demark_v6)
Now we need to read the number of the objects on the chart using MQL4.
int obj_total=ObjectsTotal();
We get the number of objects on the chart in the obj_total variable.
Now we have the number of objects and it's left to choose the necessary one to continue the further processing of the algorithm. To do it we use the typical operator of the cycle and find the "TrDup" and "TrDdown" objects.
// Determine the Trend line object
int    obj_total=ObjectsTotal();
  string index;
  for(int i=0;i<obj_total;i++)
    {
     index=ObjectName(i);
      string substrTL_down = StringSubstr (index, 0, 7);
            if (substrTL_down == "TrDdown") string TrDLine_down=index;
      string substrTL_up = StringSubstr (index, 0, 5);
            if (substrTL_up == "TrDup") string TrDLine_up=index;

    }
Then we assign their names to the TrDLine_down and TrDLine_up string variables.
Now we have the identified trend lines that we've drawn on the chart manually. Starting from this moment the indicator hooked the coordinates of the lines and is able to perform some actions with them by the necessary algorithm.
We need to get a signal for the Close of the first bar of the candlestick below the Close of the second bar, provided the trend line is between the Closes of these two bars. In such a manner, we receive a signal of crossing the trend line by the price.
if ((Close[1]>ObjectGetValueByShift(TrDLine, 1)) && (Close[2]<ObjectGetValueByShift(TrDLine, 2)))
Now we just need to execute the Alert and execute the sound media file or draw, for example, an arrow on the chart near the bar of trend line crossing.
This method allows to easily organize the interactive cooperation with any objects manually added to a chart. Fibo levels, channels, etc.
The indicator of displaying the color zones of Fibo levels published at the Onix forum can server as an example: http://www.onix-trade.net/forum/index.php?act=attach&type=post&id=27033&setlanguage=1&langid=ru.
And the complemented by nen ZigZag indicator for automatic drawing of the Fibo levels by the last wave is here: http://www.onix-trade.net/forum/index.php?act=attach&type=post&id=27175&setlanguage=1&langid=ru.
Below I supply the code of indicator for the complex displaying of Fibo zones, indication of trend line crossing and displaying of the current price on the chart using the "Price label" object layed on the chart.
//+------------------------------------------------------------------+
//|                                               1.012_InfoFibo.mq4 |
//|                                                                  |
//|                                                     b2w@narod.ru |
//+------------------------------------------------------------------+
#property copyright "http://www.fibook.ru"
#property link      "b2w@narod.ru"

#property indicator_chart_window
#property indicator_buffers 2
#property indicator_color1 Lime
#property indicator_color2 Red
//---- input parameters
extern bool Auto_Correct_Line = false;// Auto-correction of the last Fibo point
extern bool ClearRectangle = true;//Deleting of the squares while redrawing of the Fibo levels
extern bool TargetZone = true;//Drawing of the target zones
extern int count_Alert=3; //the number of iterations of Alert
double fibs[] = {-0.618, -0.382, -0.237, 0.0, 0.145, 0.382, 0.618, 0.855, 1.0, 1.237, 1.382, 1.618};
color fibsColor[] = {Maroon, Green, ForestGreen, Teal, SteelBlue, ,
                         SteelBlue, Teal, ForestGreen, Green, Maroon};
double Old_Price;
color FontColor=Black;
string TextAlert[7];
int y=0,count_a=0;
double ftime;
double win_idx;
string NameFibs;
double Spread;
double ExtMapBufferUP[];
double ExtMapBufferDN[];
//+------------------------------------------------------------------+
//| Custom indicator initialization function                         |
//+------------------------------------------------------------------+
int init()
  {
      Spread=(Ask-Bid);

//---- indicators
   SetIndexStyle(0,DRAW_ARROW,0,1);
   SetIndexArrow(0,233);
   SetIndexBuffer(0,ExtMapBufferUP);
   SetIndexEmptyValue(0,0.0);
   SetIndexStyle(1,DRAW_ARROW,0,1);
   SetIndexArrow(1,234);
   SetIndexBuffer(1,ExtMapBufferDN);
   SetIndexEmptyValue(1,0.0);

      return(0);
  }
//+------------------------------------------------------------------+
//| Custom indicator deinitialization function                       |
//+------------------------------------------------------------------+
int deinit()
  {
//----

//----
   return(0);
  }
//+------------------------------------------------------------------+
//| Custom indicator iteration function                              |
//+------------------------------------------------------------------+
int start()
  {
if(ftime!=Time[0]) count_a=0;
//  int    counted_bars=IndicatorCounted();
//----
// Determine if there are the Fibo levels or not
int    obj_total=ObjectsTotal();
  string index;
  for(int i=0;i<obj_total;i++)
    {
     index=ObjectName(i);
      string substr = StringSubstr(index, 0, 4);
            if (substr == "Fibo")  NameFibs=index;
      string substrTL = StringSubstr (index, 0, 9);
            if (substrTL == "Trendline")
            string TrDLine=index;
      string substrPR = StringSubstr (index, 0, 5);
            if (substrPR == "Arrow")
            string PR=index;
    }


// Parameters of the trend line
      if (StringLen(TrDLine)>1)
         {
            if (ObjectGet(TrDLine, OBJPROP_PRICE1)>ObjectGet(TrDLine, OBJPROP_PRICE2))
               {
               if ((Close[1]>ObjectGetValueByShift(TrDLine, 1)) &&
                                        (Close[2]<ObjectGetValueByShift(TrDLine, 2)))
                 {
                  ExtMapBufferUP[1]=(Low[1]-5*Point); /*Alert (Symbol(),"  Trend UP enter");*/
                  c_alert(1);
                 }
               }
            else
            if (ObjectGet(TrDLine, OBJPROP_PRICE1)<ObjectGet(TrDLine, OBJPROP_PRICE2))
               {
               if ((Close[1]<ObjectGetValueByShift(TrDLine, 1)) &&
                                        (Close[2]>ObjectGetValueByShift(TrDLine, 2)))
                  {
                   ExtMapBufferDN[1]=(High[1]+5*Point);/*Alert (Symbol(),"  Trend DN enter");*/
                     c_alert(1);
                  }
               }
         }
// The end of calculation of the trend line
if (StringLen(NameFibs) <1) return(-1);// If there are no Fibo levels, then we exit
// Determine where the Fibo levels are drawn
double pr1=ObjectGet(NameFibs, OBJPROP_PRICE1);// first price High
double pr1vrem=ObjectGet(NameFibs, OBJPROP_TIME1);// first time of the price
double pr2=ObjectGet(NameFibs,OBJPROP_PRICE2);// second price Low
double pr2vrem=ObjectGet(NameFibs, OBJPROP_TIME2);// second time of the price
double fibprop=(pr1-pr2);// The difference between HIGH and LOW
double Timeend=(Time[0]+(Period()*360)); // The right side by the time
                                         // to display the objects on the chart
double TimeNachalo=(Time[0]+Period()*60);// The right side by the time
                                         // to display the objects on the chart
//+++
            ObjectMove(PR, 0,Time[0], Bid);// The icon of the current price
//+++
// Parameters of the rectangle of the reverse zone..
double verx=(pr1-fibprop*0.382);
double niz=(pr2+fibprop*0.382);
string UP=DoubleToStr(verx+Spread,Digits);
string DN=DoubleToStr(niz-Spread,Digits);
  if (Auto_Correct_Line==true)
      {
         if (High[0]>pr1) ObjectMove(NameFibs, 0,Time[0], High[0]);
         if (Low[0]<pr2) ObjectMove(NameFibs, 1,Time[0], Low[0]);
      }
   if (ClearRectangle == true) ObjectsDeleteAll(0,OBJ_RECTANGLE);// Delete the RECTANGLES objects
// Draw the rectangles in the cycle
        for( y=0;y<11;y++)
      {
      ObjectCreate(("Kvadrat"+y), OBJ_RECTANGLE, 0, TimeNachalo,(pr2+fibprop*fibs[y]),
                                                        Timeend,(pr2+fibprop*fibs[y+1]) );
      ObjectSet(("Kvadrat"+y),OBJPROP_COLOR,fibsColor[y]);
      }
// The end of drawing

                                /* Drawing of the rectangle of the ZONE */
 ObjectCreate("Kvadrat", OBJ_RECTANGLE, 0, TimeNachalo, verx , Timeend , niz);
 ObjectSet("Kvadrat",OBJPROP_BACK,false);

// The array of text data
       TextAlert[0] =   "Attention two targets ";
       TextAlert[1] =   ("Order up * "+UP);
       TextAlert[2] =   ("Order down   * "+DN);
       TextAlert[3] =   ("TARGET up 2  * "+(DoubleToStr(pr1+fibprop*0.618,Digits)));
       TextAlert[4] =   ("TARGET up 1  * "+(DoubleToStr(pr1+fibprop*0.382,Digits)));
       TextAlert[5] =   ("TARGET down 1  * "+(DoubleToStr(pr2-fibprop*0.382,Digits)));
       TextAlert[6] =   ("TARGET down 2  * "+(DoubleToStr(pr2-fibprop*0.618,Digits)));
double YDist[] = {20, 55, 80, 120, 150, 180, 210};
color TextAlertClr[] = {Yellow, Green, Red, Green, Green, Red, Red};

// Output to the screen the message about orders entering
              for(y=0;y<7;y++)
               ObjectDelete("TextAlerts"+y);
if (TargetZone == true)
      {
      if (Bid > niz && Bid < verx)
            for(y=0;y<7;y++)
                  {
                  ObjectCreate(("TextAlerts"+y), OBJ_LABEL, 0, 0, 0);
                  ObjectSetText(("TextAlerts"+y),TextAlert[y], 12, "Times New Roman",TextAlertClr[y]);
                  ObjectSet(("TextAlerts"+y), OBJPROP_CORNER, 0);
                  ObjectSet(("TextAlerts"+y), OBJPROP_XDISTANCE, 10);
                  ObjectSet(("TextAlerts"+y), OBJPROP_YDISTANCE, YDist[y]);
                  }
      }

// The informer of the price and the currency name
ObjectDelete("Market_Price_Label101");
   ObjectCreate("Market_Text_Label101", OBJ_LABEL, 0, 0, 0);
   ObjectSetText("Market_Text_Label101", (Symbol()+"  "+Period()), 16, "Times New Roman", Yellow);
   ObjectSet("Market_Text_Label101", OBJPROP_CORNER, 2);
   ObjectSet("Market_Text_Label101", OBJPROP_XDISTANCE, 5);
   ObjectSet("Market_Text_Label101", OBJPROP_YDISTANCE, 5);

  return(0);
  }

//+------------------------------------------------------------------+

void c_alert(int w)
 {
 ftime=Time[0];
 if(count_a<count_Alert)
 {count_a+=1;
 PlaySound("ku_ku.wav");
 }
 }
 return;
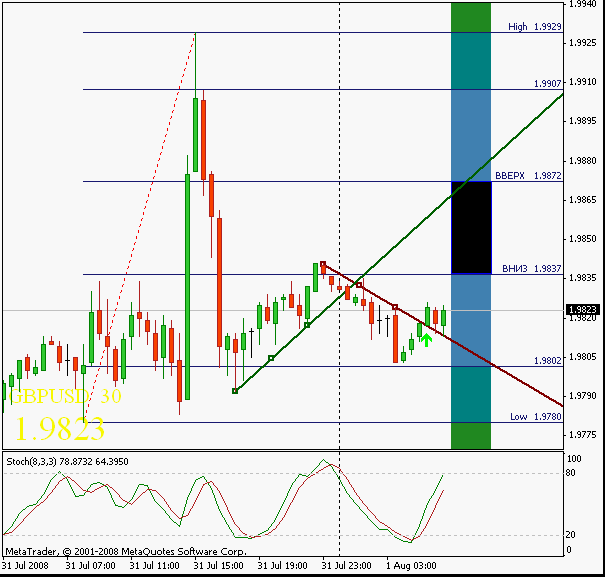
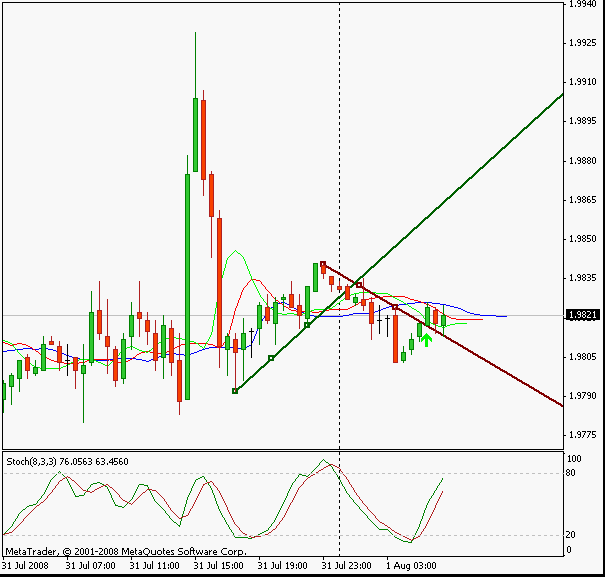
The crossing of the trend line on the GBPUSD hourly chart is shown at the next picture.
Conclusion
The application of this approach to processing of the received data is a good help in the trader's work. Just relieving one's eyes and releasing from the continuous waiting for the necessary moment for activating or closing a position gives not only the decrease of emotional stress, but also increases the chances not to miss the necessary moments in trading.
And to make everything quite easy for you, I attach the template of the GBP chart that you should put at the \templates\ folder.
The indicator itself should be put at the \experts\indicators\ folder.
And the sound file should be put at the \sounds\ folder.
Translated from Russian by MetaQuotes Ltd.
Original article: https://www.mql5.com/ru/articles/1546
Warning: All rights to these materials are reserved by MetaQuotes Ltd. Copying or reprinting of these materials in whole or in part is prohibited.
This article was written by a user of the site and reflects their personal views. MetaQuotes Ltd is not responsible for the accuracy of the information presented, nor for any consequences resulting from the use of the solutions, strategies or recommendations described.
 How to Write Fast Non-Redrawing ZigZags
 Changing the External Parameters of MQL4 Programs without Restarting
 Expert Advisors Based on Popular Trading Strategies and Alchemy of Trading Robot Optimization (Part VI)
 Drawing Horizontal Break-Through Levels Using Fractals
- Free trading apps
- Over 8,000 signals for copying
- Economic news for exploring financial markets
You agree to website policy and terms of use
Hi Vladimir
Your presentation is very interesting, and i endorse my cumpliments for your labour. Infortunatly, there's something wrong with your set of indicators, as the only thing that appears on the chart is the price within a square, and on the left bottom the name of the pair with a number (i suppose it is the fibo number at~the moment). By other side, the two
indicatiors mentioned on your text when displayed are in russian, which turns it hard to understand as you can imagine (except for a russina).
Please provide correction in order it can appear the chart grafism equivalent to your first chart representation.
Much obliged.
netpacman (netpacman@sapo.pt)