
Idleness is the Stimulus to Progress. Semiautomatic Marking a Template
Introduction
Any marking is determining the extremums on a chart and composing some user-defined figures or lines on the basis of these points. The Elliott's waves followers need to mark certain waves and the conclusions (which wave it is), determining the number, etc. The Wolf's waves disciples need to draw trend lines and to denote targets. The "Butterfliers" need points and levels for determining the prospective butterflies, crabs and the other figures formalized by Gartley.
Murrey levels are necessary for those who prefer this method. The automatic calculation does not allow us to involve hundreds, or maybe thousands of formation, if only it is not a special software. On the other hand, anyone can see the disadvantages of automatic marking in the consequence of condition-formalizing methods. And not every software allows us to intervene into the marking process. So, the application of manual marking and the assignment of the further data processing to the computer widen the user's capabilities.
Semiautomatic Marking a Trading Template
Let's consider marking Wolf's waves, for example. (The description is taken from Linda Raschke's famous book «Street Smarts»).
Bill's theory of wave structure is based on Newton's first law of physics: for every action there is an opposite reaction. This movement creates a definite wave with valuable projecting capabilities. This wave most clearly sets up when there is good volatility.
By starting with a top or bottom on the bar chart, we are assured of beginning our count on a new wave. This count is for a buy setup. We begin the count at a top. (The wave count would be reversed if we were starting at the bottom looking for a sell setup).
- Number 2 wave is a top.
- Number 3 wave is the bottom of a first decline.
- Number 1 wave is the bottom prior to wave 2 (top). Point 3 must be lower than point 1.
- Number 4 wave is the top of wave 3. The wave 4 point should be higher than the wave 1 bottom.
- A trend line is drawn from point 1 to point 3. The extension of this line projects to the anticipated reversal point which we will call wave 5. this is the entry point for a ride to the EPA line (1 to 4).
- The Estimated Price at Arrival (EPA) is the trend line drawn from points 1 to 4. This projects the anticipated price objective. Our initial stop is placed just beneath the newly formed reversal at point 5. It can then be quickly moved to breakeven.
IMPORTANT POINT: You cannot begin looking for the Wolfe Wave until points 1, 2, 3, and 4 have been formed.
Keep in mind that point 3 must be lower than point 1 for a buy setup. It must be higher than point 1 for a sell setup. Also, on the best waves point 4 will be higher than point 1 for a buy setup and lower than 1 for a sell setup. This ensures that absolute runaway market conditions do not exist. Now, study the examples and see if you can train your eye to begin to see the Wolfe Wave setup.
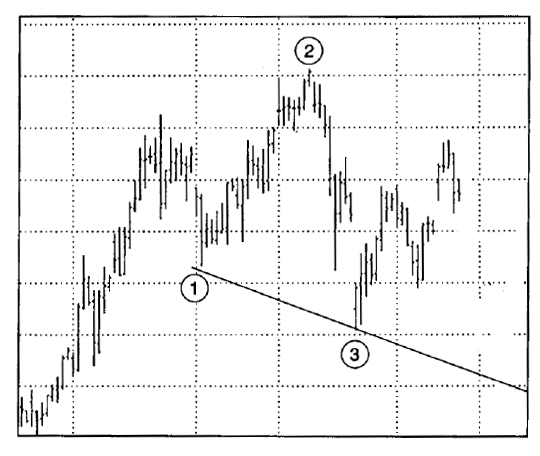
Exhibit illustrates what a Wolfe Wave looks like when it is starting to form. Point 1, 2, and 3 must already have formed. Point 2 must be a significant swing low or high. A trend line is then drawn between points 1 and 3. This projects where we should anticipate point 5.
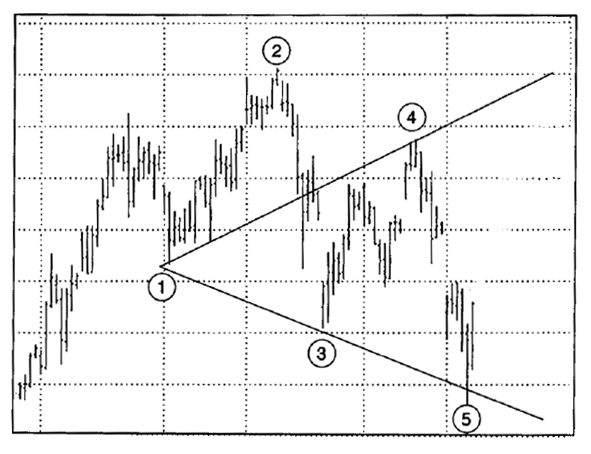
Point 5 is formed. We will buy the reversal from this area and place a tight stop underneath. If we draw a trend line from point 1 to point 4, it should give us a price projection.
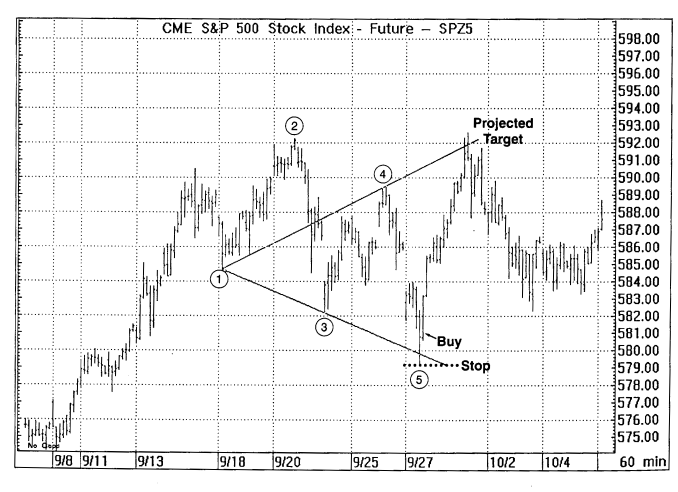
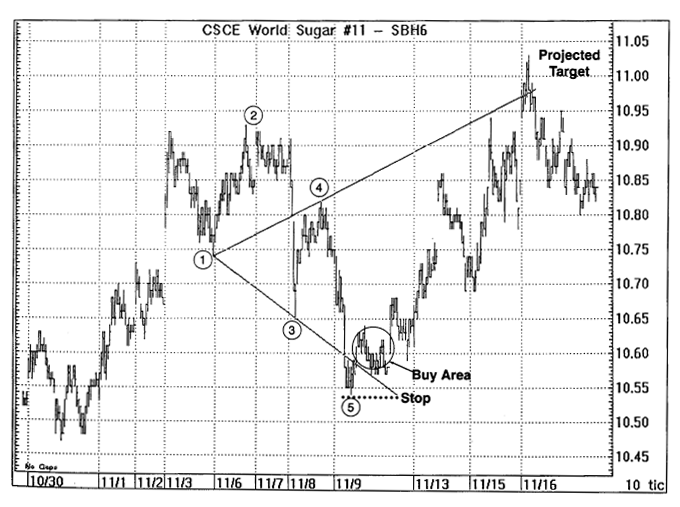
Point 2 is the initial starting point for the pattem. I always find it easiest to start the count at this point. Then, backtrack and find point 1 and 3. Don't forget that point 4 must be higher than point 1. Our trend line is drawn projecting point 5. The market finds support at this level, so we enter a long position at the market and place a stop just below point 5. The market trades to its objective.
According to the attached description, we need to mount the marking with the special symbols (digits from 1 to 5, and then draw the trend lines from the point 1 that pass the 4 and 5 points.)
In the manual method the text objects are created and assigned to the specified points on the chart, then the trend lines are created and layed on the chart. The features of the programming language allow to simplify the process and except the creation of objects and the drawing of trend lines from the process. In this approach the user is remained to assign the marks to the certain points on the chart and get the ready drawing of the trend lines.
We remind that there are two ways to lay the information on the chart.
The first one is when a created text object is assigned to a certain point on the chart, and the second one is when the binding is assigned to a certain point of the window of the chart.
Let's use these features to create different objects. We create the "OnOff" button to remove already applied objects and already drawn lines, and bind it to a certain point of the window. And we create the objects that will be binded to the specified points on the chart. Considering that the chart can be rescaled and the objects will be shifted together with the chart, we determine the initial position of the tie points to the right of the zero bar of the chart. We will use this position for activation and deactivation of the function of trend lines drawing.
// Check the presence of the "OnOff" button, create it in case of absence
int    obj_total=ObjectsTotal();
  string index;
  for( i=0;i<obj_total;i++)
    {
     index=ObjectName(i);
      string Lbl = StringSubstr (index, 0, 12);
            if (Lbl == "Lable_On_Off") string LblOnOff=index;
     }
if (LblOnOff!="Lable_On_Off") OnOff(Red, 10);
where
OnOff(Red, 10);is the function of creating and positioning of the "OnOff" button.
void OnOff (color clr_, int h)
         {
         ObjectCreate("Lable_On_Off",OBJ_LABEL,0,0,0);// Creation of the "OnOff" button
         ObjectSetText("Lable_On_Off",CharToStr(204) , 12, "Wingdings", clr_);
         ObjectSet(   "Lable_On_Off", OBJPROP_CORNER, 3);     // The angle of displaying on the chart
         ObjectSet(   "Lable_On_Off", OBJPROP_XDISTANCE, 10);
         ObjectSet(   "Lable_On_Off", OBJPROP_YDISTANCE, h);
         }
return;
Embedded function
CharToStr()
allows to display any objects on the chart
"Wingdings"just by inputting the codes of the symbols.
We perform the activation of the indicator by selecting and moving the "OnOff" button up. After moving and coming of the first tick of the chart, the button is assigned to the other position and changes its color to green, and we display the objects to the right of the first bar: digits for the enumeration on the chart by the functon.
We manage the objects on the chart depending on the position of the button.
// Check if the "OnOff" button is at its place

if (ObjectGet("Lable_On_Off",OBJPROP_XDISTANCE)>70||
    ObjectGet("Lable_On_Off",OBJPROP_YDISTANCE)<20)// if it is not there then
       {
          OnOff(Red, 10);// we move the "OnOff" button to its place and delete all marks, channel, trend line
         for ( i=0; i<point_kol; i++)
            ObjectDelete("Lable_"+i);
            ObjectDelete("TRDLine");
            ObjectDelete("FIBOCanal");
         return;
         }

if (ObjectGet("Lable_On_Off",OBJPROP_YDISTANCE)>10 &&
    ObjectGet("Lable_On_Off",OBJPROP_YDISTANCE)!=40) //If the button is moved upwards then
       {
         OnOff(Green, 40); // we fix it up there
         CreatePoint();   // Create points
       }
where
CreatePoint();
is the function of initial positioning of the calculated points on the chart.
void CreatePoint ()
      {
      double shcala=(WindowPriceMax()-WindowPriceMin());
      for( i = 0; i < point_kol; i++) // Create points
               {
      ObjectCreate("Lable_"+i, OBJ_ARROW, 0,Time[Bars-1],Bid);
      ObjectSet("Lable_"+i,OBJPROP_ARROWCODE,140+i);
      ObjectSet("Lable_"+i,OBJPROP_WIDTH,2);
      ObjectSet("Lable_"+i,OBJPROP_COLOR,Green);
      ObjectMove("Lable_"+i, 0,(Time[0]+Period()*720), (WindowPriceMin()+shcala/2)-shcala/12*i);
               }
      }
Here I want to draw your attention that only three points are active if this marking is used, so I added an external variable to make possible the choice of how many points to use for applying to the chart, 3 or 5. The default value is 5, but I use 3 visually noting the intermidiate points for myself.
extern int point_kol=5;
We use the Fibo channel instead of the trend line directed to the presumed price movement. It provides the expanded guidance on the chart. The channel provides the guidance about the support and resistance lines on the Fibo levels. In this representation we can observe the targets at the intersections of the trend line and the Fibo levels, it allows to allocate the certain trading tactics.
Here what it will look like:
We turn on the indicator and move the button upwards.
The daily chart. We placed the points and the indicator created the trend line and the Fibo channels.
Conclusion
This kind of representation of information on the chart alllows to implement, for example, the analysis by Elliot's waves. As we determined two extremum points manually, we can recalculate the internal waves using a timeframe of a lower period, and obtain a result for a further analysis comparing it with the specified conditions. At that, a user can specify an explicit value of the recalculation (impulse or correctional).
Here I also want to desire the developers of the MQL4 language to add the functon of recalculation of window positioning of objects in pixels for the direct binding to the chart. The point is that the proposed at the moment method of accessing to the user32.dll library and calling the parameters of the current window from it shows the message that the user32.dll is absent. This means that there is no such feature in a typical delivery of Windows XP and MetaTrader 4. In this implementation I had to refuse from the implantation of possibility of analysing through whole chart, if only not moving the points manually.
The indicator itself (source code):
//|                                                        0_CTL.mq4 |
//|                                   Copyright © 2008, b2w@narod.ru |
//|                                             http://www.fibook.ru |
//+------------------------------------------------------------------+
#property copyright "b2w@narod.ru"
#property link      "http://www.fibook.ru"
#property indicator_chart_window
extern int point_kol=5;
string mon[]={"january",
              "february",
              "march",
              "april",
              "may",
              "june",
              "july",
              "august",
              "september",
              "october",
              "november",
              "december"};
int i;
double coordinatsT[5], coordinatsP[5];
//+------------------------------------------------------------------+
//| Custom indicator initialization function                         |
//+------------------------------------------------------------------+
int init()
  {
//---- indicators
  string info="Marking  "+ Symbol()+" by "+Day()+" "+mon[Month()-1]+" "+Year()+" г.";
   CreateUp (info);

//----
   return(0);
  }
//+------------------------------------------------------------------+
//| Custom indicator deinitialization function                       |
//+------------------------------------------------------------------+
int deinit()
  {
//----

//----
   return(0);
  }
//+------------------------------------------------------------------+
//| Custom indicator iteration function                              |
//+------------------------------------------------------------------+
int start()
  {
//----

// Check the presence of the "OnOff" button, create it in case of absence
int    obj_total=ObjectsTotal();
  string index;
  for( i=0;i<obj_total;i++)
    {
     index=ObjectName(i);
      string Lbl = StringSubstr (index, 0, 12);
            if (Lbl == "Lable_On_Off") string LblOnOff=index;
     }
if (LblOnOff!="Lable_On_Off") OnOff(Red, 10);
// Check if the "OnOff" button is at its place

if (ObjectGet("Lable_On_Off",OBJPROP_XDISTANCE)>70||
    ObjectGet("Lable_On_Off",OBJPROP_YDISTANCE)<20)// if it is not there then
       {
          OnOff(Red, 10);// we move the "OnOff" button to its place and delete all marks, channel, trend line
         for ( i=0; i<point_kol; i++)
            ObjectDelete("Lable_"+i);
            ObjectDelete("TRDLine");
            ObjectDelete("FIBOCanal");
         return;
         }

if (ObjectGet("Lable_On_Off",OBJPROP_YDISTANCE)>10 &&
    ObjectGet("Lable_On_Off",OBJPROP_YDISTANCE)!=40) //If the button is moved upwards then
       {
         OnOff(Green, 40); // Fix it up there
         CreatePoint();   // Create points
       }

           for (i=0; i<point_kol; i++)
               {
                 coordinatsT[i]=ObjectGet("Lable_"+i,OBJPROP_TIME1); // Read the coordinates
                 coordinatsP[i]=ObjectGet("Lable_"+i,OBJPROP_PRICE1);
               }

         // if all points are carried to the chart then we draw the additional objects
         if  ((coordinatsT[0]<Time[0])&&
              (coordinatsT[1]<Time[0])&&
              (coordinatsT[2]<Time[0])&&
              (coordinatsT[3]<Time[0])&&
              (coordinatsT[4]<Time[0]))
            {
            ObjectCreate("TRDLine", OBJ_TREND, 0,0,0);
            ObjectCreate("FIBOCanal", OBJ_FIBOCHANNEL, 0,0,0);
            ObjectMove ("TRDLine", 0,coordinatsT[0],coordinatsP[0]);
            ObjectMove ("TRDLine", 1,coordinatsT[point_kol-2],coordinatsP[point_kol-2]);
            ObjectMove ("FIBOCanal", 0,coordinatsT[0],coordinatsP[0]);
            ObjectMove ("FIBOCanal", 2,coordinatsT[point_kol-2],coordinatsP[point_kol-2]);
            ObjectMove ("FIBOCanal", 1,coordinatsT[point_kol-1],coordinatsP[point_kol-1]);
            }
   return(0);
  }
//+------------------------------------------------------------------+

void OnOff (color clr_, int h)
         {
         ObjectCreate("Lable_On_Off",OBJ_LABEL,0,0,0);// Creation of the "OnOff" button
         ObjectSetText("Lable_On_Off",CharToStr(204) , 12, "Wingdings", clr_);
         ObjectSet(   "Lable_On_Off", OBJPROP_CORNER, 3);     // The angle of displaying on the chart
         ObjectSet(   "Lable_On_Off", OBJPROP_XDISTANCE, 10);
         ObjectSet(   "Lable_On_Off", OBJPROP_YDISTANCE, h);
         }
return;

void CreatePoint ()
      {
      double shcala=(WindowPriceMax()-WindowPriceMin());
      for( i = 0; i < point_kol; i++) // Create points
               {
      ObjectCreate("Lable_"+i, OBJ_ARROW, 0,Time[Bars-1],Bid);
      ObjectSet("Lable_"+i,OBJPROP_ARROWCODE,140+i);
      ObjectSet("Lable_"+i,OBJPROP_WIDTH,2);
      ObjectSet("Lable_"+i,OBJPROP_COLOR,Green);
      ObjectMove("Lable_"+i, 0,(Time[0]+Period()*720), (WindowPriceMin()+shcala/2)-shcala/12*i);
               }
      }
 void CreateUp(string info)
               {
                  ObjectCreate("TextAlerts", OBJ_LABEL, 0, 0, 0);
                  ObjectSetText("TextAlerts",info , 16, "Times New Roman", Green);
                  ObjectSet("TextAlerts", OBJPROP_CORNER, 0);
                  ObjectSet("TextAlerts", OBJPROP_XDISTANCE, 20);
                  ObjectSet("TextAlerts", OBJPROP_YDISTANCE, 10);
               }
Translated from Russian by MetaQuotes Ltd.
Original article: https://www.mql5.com/ru/articles/1556
Warning: All rights to these materials are reserved by MetaQuotes Ltd. Copying or reprinting of these materials in whole or in part is prohibited.
This article was written by a user of the site and reflects their personal views. MetaQuotes Ltd is not responsible for the accuracy of the information presented, nor for any consequences resulting from the use of the solutions, strategies or recommendations described.
 View of Technical Analysis in the Context of Automatic Control Systems (ACS), or "Reverse View"
 HTML Walkthrough Using MQL4
 To Sleep, or Not to Sleep?
 Expert Advisors Based on Popular Trading Strategies and Alchemy of Trading Robot Optimization (Part VI)
- Free trading apps
- Over 8,000 signals for copying
- Economic news for exploring financial markets
You agree to website policy and terms of use
We are always online everday, if you have any questions about WOW gold www.iwowleveling.com , wow leveling www.wowlevelingus.com , please talk to our representatives via 24*7*365 live chat service. WOW Gold price on All servers are slashed! Now we have full of WOW gold on Euro Server in stock.
Hello,
Thanks for the nice Study.
I did add the indicator on my chart, but I have a red button on the lower right but I don’t know how to turn it on, when I double click on it is says in the property box “Lable_On_off” I believe it means that the button function is not working, also I don’t see the Wingdings as shown on the chart above, can you advise what could be wrong? Also What other indicators should be available at the indicators list?
Thanks for your help
If you have any questions write on the site http://fibook.ru in "Contact svz" - ("Обратная связь")
Thanks for your work on this indicator and sharing with others.
I have the same problem as alkahaat above. I have downloaded, compiled, and applied both the english and russian versions and they both do the same thing.
Probably a small misunderstanding of your instructions. Please walk me throught this...
1) There is a red square "button" in right lower corner. I click on this and a box appears around it. (I assume this is "turned on" state)
2) Nothing else happens. I can drag the box around, but no number circles appear when the box is dragged.
3) If I drag the box around and click on it it sometimes turns green...but that's all that happens ( forex metatrader & Alpari UK)
Thanks for any help with this
When trying to compile this error occurs.