Top Gun Oscillators
- Indikatoren
- Version: 1.6
- Aktualisiert: 31 Mai 2023

Hinweis: Neu in 1.6: Der Indikator exportiert jetzt das Handelssignal (wird aber nicht angezeigt). Gehen Sie mit hellblau long. Short gehen mit rot. Sonst aussteigen. Das Signal muss mit iCustom in Ihren EA importiert werden.
Dieser Indikator bietet die besten linearen Filter-Momentum-Oszillatoren, die mir bekannt sind (Low Pass Differentiators, LPD's). Alle diese Oszillatoren sind neuere Entwicklungen von diesem Entwickler oder anderen Forschern. Die Oszillatorlinie ist der erste Puffer des Indikators und kann in anderen Indikatoren oder EA's von iCustoms aufgerufen werden.
In meinem früheren IndikatorTrue Momentum habe ich kurz die Eigenschaften eines echten Momentum-Oszillators beschrieben und die Schwäche einiger der in der technischen Analyse verwendeten Oszillatoren aufgezeigt. Der Oszillator in diesem Indikator war der Biquad LPD, von dem gezeigt wurde, dass er besser ist als der MACD, aber es wurde nicht behauptet, dass er der optimale Momentum-Oszillator ist (in der Hoffnung, dass es keine Missverständnisse gibt). Einige der anderen Oszillatoren, die hier angeboten werden, könnten die Leistung des Biquad übertreffen, wie in dieser Beschreibung gezeigt wird. Die Gleichungen für die Berechnung der Filter werden angegeben, wenn es einfach ist, dies zu tun Dieser Indikator soll sowohl lehrreich als auch nützlich sein. Lassen Sie uns also mit einigen weiteren Mythen aufräumen, die im Bereich der Technischen Analyse anzutreffen sind. Leider gibt es in diesem Bereich zahlreiche Missverständnisse, und oft werden Behauptungen aufgestellt, ohne dass sie bewiesen oder auch nur richtig verstanden werden. Wir werden uns hier auf Behauptungen konzentrieren, die sich mit dem Momentum befassen, und das sind:
1- Der herkömmliche Indikator "Momentum Oscillator", der die Differenz (oder das Verhältnis) zwischen dem aktuellen Kurs und dem Kurs der p-Periode darstellt, wurde bereits in meinem Vorabdruckhier falsifiziert. Das Momentum wird nicht als Preisdifferenz berechnet.
2. Obwohl der MACD einige der erforderlichen Eigenschaften besitzt, um die Beschreibung eines Momentum-Oszillators zu erfüllen (siehe meinen Preprint), ist dies ein Zufall - nicht beabsichtigt. Es ist nichtallgemein zutreffend , dass das Momentum als die Differenz zwischen einem schnellen und einem langsamen gleitenden Durchschnitt definiert werden kann.
3. Die Behauptung, dass Momentum-Oszillatoren vorlaufende Indikatoren sind, bedarf einer Klarstellung. Die Begriffe "vorauseilend" und "nacheilend" haben in der Schwingungsmathematik und in der Physik ganz bestimmte Bedeutungen. Der Ausgang eines digitalen Filters hinkt dem Eingang immer hinterher, wie es das Kausalitätsprinzip erfordert. Was ist also damit gemeint, dass beispielsweise der MACD ein vorlaufender Indikator ist? Als Momentum-Oszillator ist die wichtigste Information, die er liefern kann, die Richtung des Kurses. Ein positiver MACD deutet auf steigende Kurse hin, ein negativer auf fallende Kurse. Da die Richtungsänderung des Preises einer der wichtigsten Faktoren bei Handelsentscheidungen ist, sollte der Nulldurchgang der MACD-Linie, der angeblich eine Richtungsänderung des Preises bedeutet, die wichtigste Information dieses Indikators sein. Wenn Sie jedoch auf alle Nulldurchgänge des MACD achten (verwenden Sie lange Zeiträume, um Volatilitätseffekte zu minimieren), werden Sie feststellen, dass sie immer mit Verzögerung gegenüber der auf dem Kurschart sichtbaren Kursumkehr erfolgen. Sie führen nie. Die technischen Analysten behaupten jedoch, dass die WERTUMKEHR des Oszillators vor der Preisumkehr stattfindet. Dies könnte der Fall sein, ist aber nicht sicher. Wenn wir die Umkehrung eines richtigen Momentum-Oszillators betrachten, untersuchen wir die Beschleunigung (oder Verlangsamung) des Preises. Es stimmt, dass die Beschleunigung die Preisbewegung nach einem bestimmten Zeitintervall bestimmt, vorausgesetzt, die Beschleunigung ist konstant oder ändert sich nicht sehr stark - aber das ist nur selten der Fall. Auf jeden Fall sollte der Momentum-Oszillator von hoher Qualität und sehr geringem Rauschen sein, um eine Beschleunigung zu erkennen. Aber die Hauptlinie des MACD, die die 9-Perioden-Signallinie kreuzt, ist nicht von hoher Qualität.
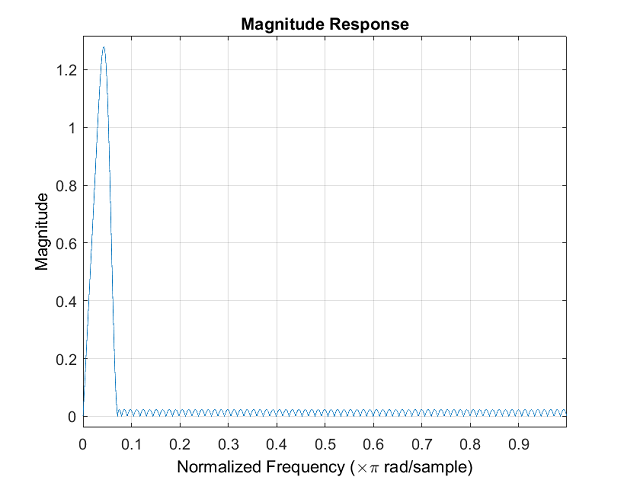
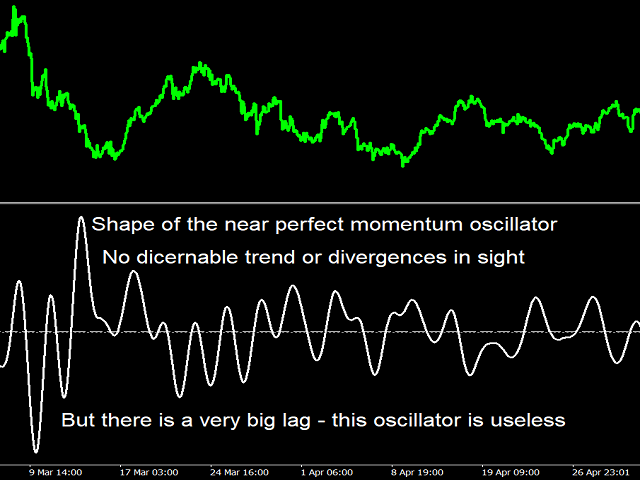
3. Ein echter Momentum-Oszillator stellt nicht den Preis selbst dar, sondern die Veränderung des Preises. Der Versuch, aus dem Momentum-Oszillator den Preistrend abzulesen, ist also prinzipiell falsch. Der Grund dafür, dass es Restinformationen über den Trend gibt (wie z. B. Höchst- oder Tiefststände), hat mit dem "Durchsickern" des Filters zu tun. Alle diese Informationen sollten vom Momentum-Oszillator entfernt worden sein. Betrachten Sie den Filter mit dem in Abbildung 2 gezeigten nahezu perfekten Frequenzgang. Dieser Filter wurde mit der Filter Design App von Matlab im Dienstprogramm Signalverarbeitung entworfen. Der von diesem Filter erzeugte Oszillator ist in Abbildung 3 dargestellt. Es sind nur glatte Kurvenlinien zu sehen, die keine Informationen über den Trend enthalten. Beachten Sie jedoch, wie stark dieser Oszillator im Vergleich zum Preis selbst nachhängt. Er hat die perfekte Form eines Momentum-Oszillators, ist aber wegen der großen Verzögerung nutzlos. Wer versucht, den Trend aus einem Momentum-Oszillator abzulesen, melkt die kränkelnde Kuh. (Dies gilt nicht fürmeinenBiquad-Hochpassfilter, dessen Zweck es ist, Divergenzen und Trends im kleinen/mittleren Bereich hervorzuheben, oder für den RSI zum Beispiel, denn der RSI ist kein Momentum-Oszillator, wie fälschlicherweise angenommen wird, sondern ein Hochpassfilter-Entzerrer).
4. Da die Trendfolge für einen Momentum-Oszillator bedeutungslos ist, und da alle Ober- und Untergrenzen in einem guten Oszillator verschwinden sollten, folgt daraus, dass die Verfolgung von Divergenzen keine gute Praxis ist. Auch hier versucht man wieder, aus dem nicht beachteten Müll zu lesen.
5. Zeigt die Steigung eines gleitenden Durchschnitts die Dynamik an? Ja, aber der gleitende Durchschnitt (oder Tiefpassfilter) muss die entscheidende Bedingung erfüllen, flache Durchlassbereiche in seinem Frequenzgang zu haben. Zum Beispiel hat keiner der Standard-Durchschnitte SMA, EMA oder LWMA flache Durchlassbereiche. Wenn Sie die Zeit haben, installieren Sie bitte meinenQuick n Dirty Frequency Response Indikator und spielen Sie mit ihm.
Die Erkenntnis aus dieser Diskussion ist die folgende: Nur Nulldurchgänge und Oszillatorwertumkehrungen haben eine eindeutige Bedeutung. Wenn der Momentum-Oszillator von hoher Qualität ist (d.h. linearer Frequenzanstieg, geringes Rauschen und geringe Verzögerung), dann wird er zu einem effektiven Instrument für den Handel.
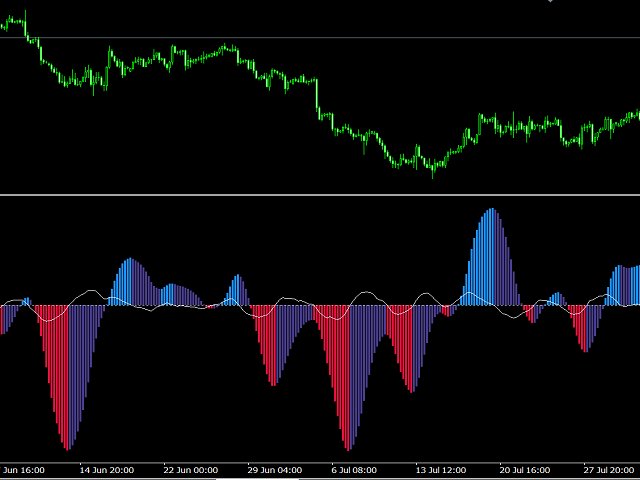
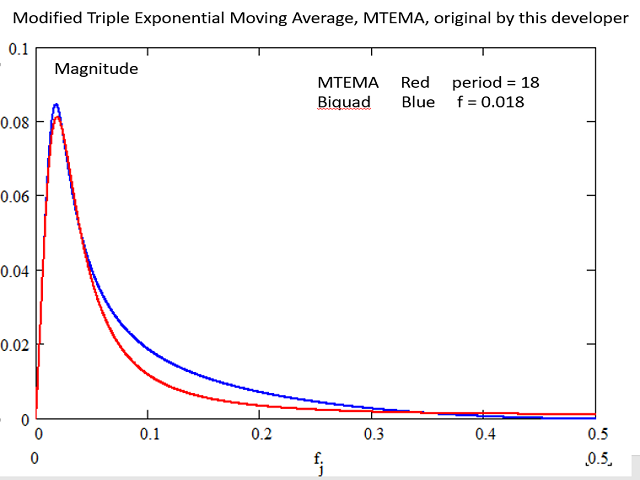
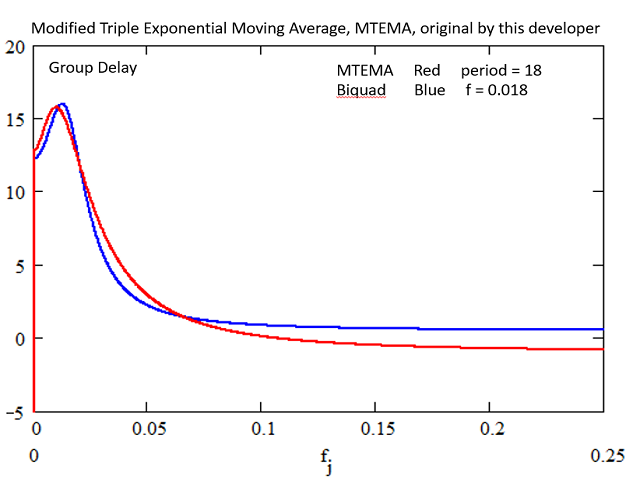
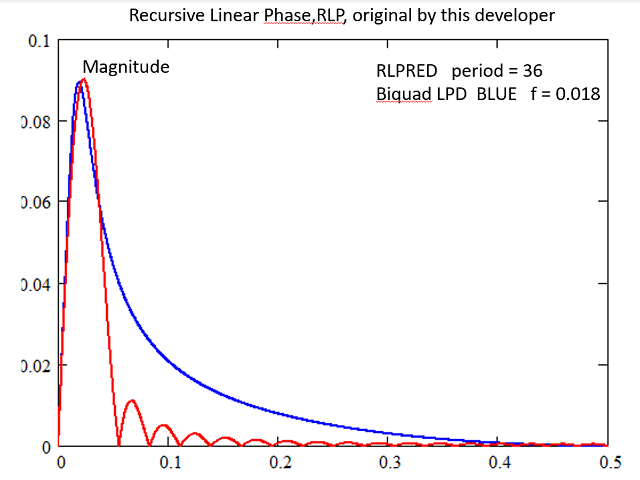
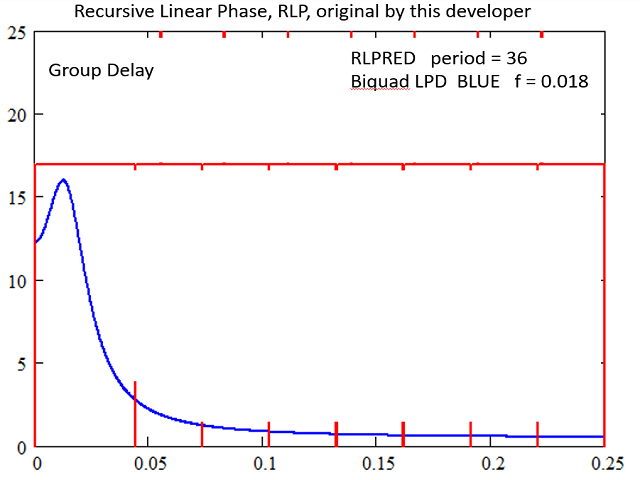
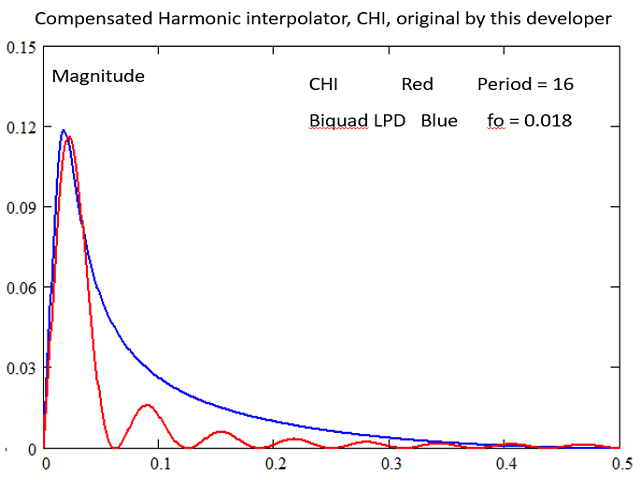
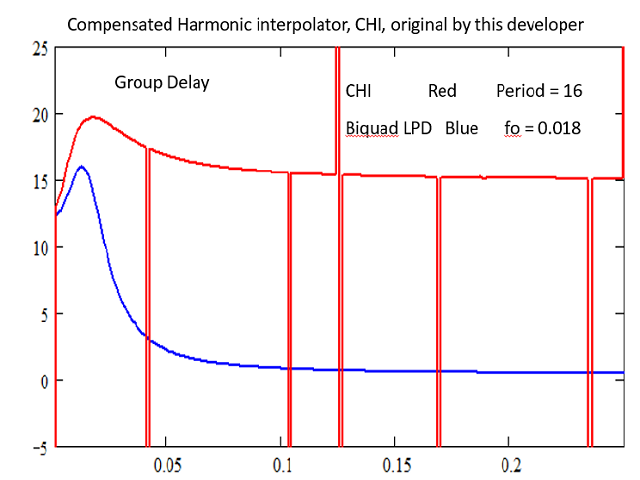
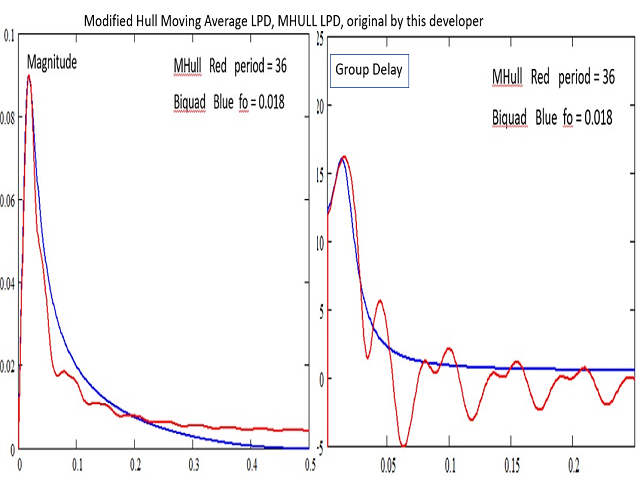
Bei der Darstellung der Momentum-Oszillatoren dieses Indikators werden wir den Biquad LPD als Referenz zum Vergleich heranziehen. Die Screenshots zeigen die Größenordnung und die Gruppenverzögerung der einzelnen Oszillatoren dieses Indikators im Vergleich zum Referenz-Biquad. Alle Perioden und Einstellungen sind so gewählt, dass sie ein ähnliches Verhalten wie der MACD(12,26) zeigen. Aber die tatsächlich besten Parameter für jeden Filter sind natürlich Gegenstand der Optimierung. Die Reaktion des MACD und des Awesome-Oszillators wurden in meinem vorherigen Produkt True Momentum beschrieben.
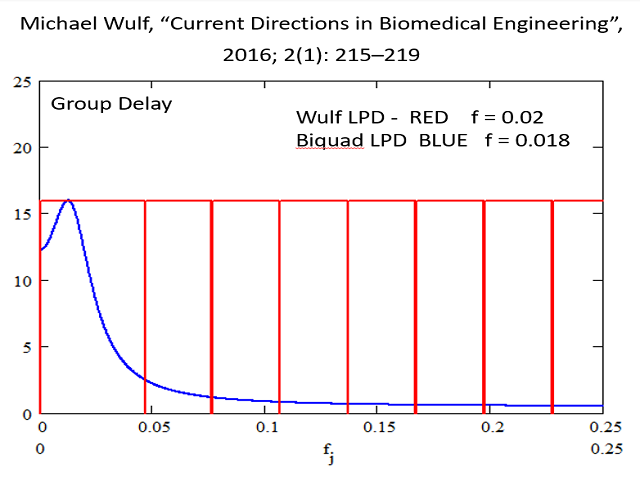
Offensichtlich sind sie alle dem MACD und dem Awsome-Oszillator bei der Unterdrückung hochfrequenter Volatilität überlegen. Vergleicht man jedoch die fünf Oszillatoren miteinander, wird ein Kompromiss sichtbar. Vielleicht bietet MTEMA die beste Darstellung im Vergleich zum Biquad. Aber meine persönlichen Favoriten sind die von WULF und meine eigene Recursive Linear Phase. Dies sind die einzigen beiden, die einen linearen Phasengang (gerade GD-Linie) aufweisen. Dies ist eine Voraussetzung für eine perfekte Rekonstruktion des Impulses.
ACHTUNG: Es besteht ein großer Unterschied zwischen einem guten Trading-Tool und dem tatsächlichen Gewinnen von Trades auf der Grundlage seiner Signale.
Und handeln Sie nur mit Geld, das Sie nicht verlieren wollen. Viel Glück!


Intéressant.