Top Gun Oscillators

5

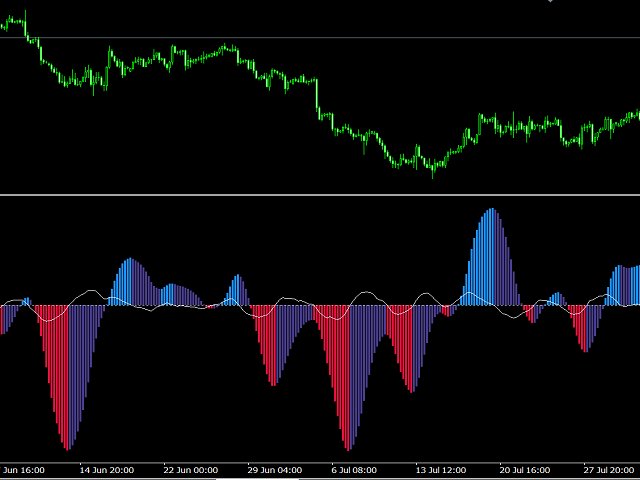
Note: New in 1.6: the indicator now exports the trade signal (but not displayed). Go long with light blue. Go short with red. Exit otherwise. Signal to be imported to your EA using iCustom.

This indicator provides Best of the Best linear filter momentum oscillators that I am aware of (Low Pass Differentiators, LPD's) . All of them are  recent developments by this developer, or other researchers. The oscillator line is the first buffer of the indicator, and can be called  in other indicators or EA's by iCustoms.

In my previous indicator True Momentum, I briefly described the characteristics of a true momentum oscillator and exposed the weakness of some of the ones used in technical analysis. The oscillator in that indicators was the Biquad LPD, where it was shown to be better than the MACD, but it was not claimed to be the optimal momentum oscillator (hoping there was no misunderstanding).  Some of the other oscillators provided here might surpass the performance of the Biquad, as will be shown in this description. The equations  for calculating the filters  are provided when its is straightforward to do so.This indicator is meant to be educational, as well as being of high utility. So let us dispel some more myths encountered in the field of Technical Analysis. Unfortunately, there are numerous misconceptions in this field, and many times claims are made without proof, or even a proper understanding. We will concentrate here on claims dealing with momentum, they are:

1- The conventional indicator "Momentum Oscillator", being the difference (or ratio) between the the current price and the price p- periods has already been falsified in my preprint here . Momentum is not calculated as the difference in price.

2. Although the MACD possesses some of the required features to fit the description of a momentum oscillator (see my pre-print), this is by accident - not by design. It is not in general  true that momentum can be defined as the difference between a fast moving average and a slow moving average. 

3. The claim that momentum oscillators are leading indicators needs  clarification. The terms "leading" or "lagging" have very specific meanings in the mathematics of oscillations, and in physics. The output of a digital filter always lags the input, as necessitated by the principle of causality. So what is really meant by the MACD, for example, being a leading indicator? Momentum is a quantity related to motion and its direction.As a momentum oscillator, the most important information it can provide is the direction of price. A positive MACD ought to indicate increasing price, while negative means decreasing price. Since price changing direction is one of the most important factor in trading decisions, then the zero-crossing of the MACD line, which supposedly means price changing direction, ought to be the the most important piece of information from this indicator. But if you pay attention to all zero crossings of the MACD (use long periods to minimise volatility effects), you will find that they are always delayed relative to the the price reversal visible on the price chart. They never lead. But the claim of technical analysts is that the VALUE REVERSAL of the oscillator happens before the reversal of price. This could happen, but without certainty. When we consider the reversal of a proper momentum oscillator, we are investigating the acceleration (or deceleration) of price. It is true that acceleration determines the price motion after an interval in time, at the assumption the acceleration is constant or not changing very much - but this is seldom the case. Anyway, the momentum oscillator should be of high quality and very low noise to discern acceleration. But the main MACD line crossing the 9 period signal line is not high quality.

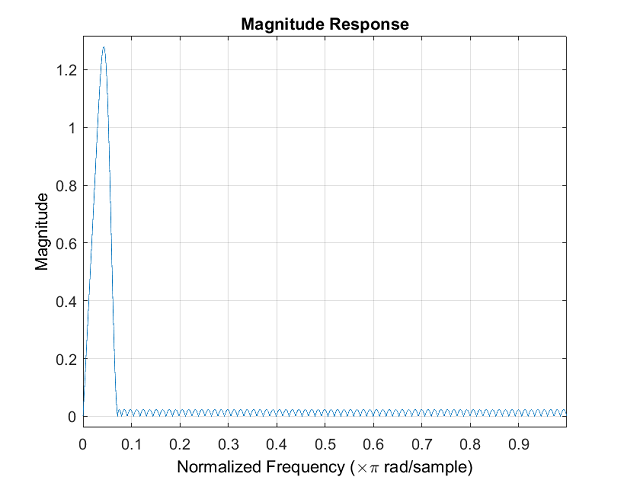
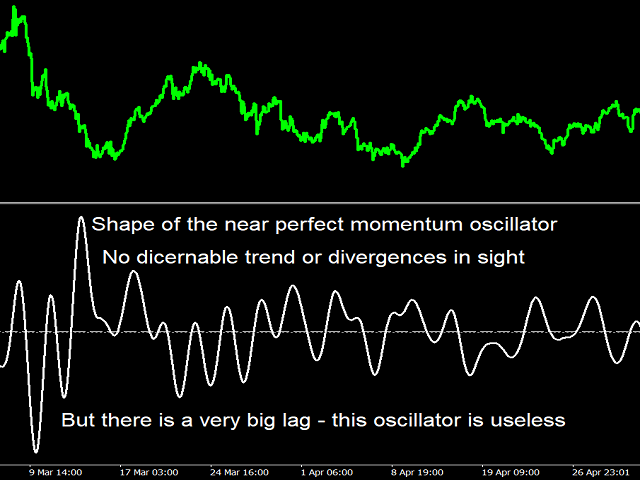
3. A true momentum oscillator does not represent the price itself, rather, it represents the change in the price. So trying to read into the price trend from the momentum oscillator is wrong in principle. The reason that there is remnant info of the trend (like tops or bottoms) has to do with the the "leakage" of the filter. All this info should have been removed by the momentum oscillator. Consider the filter having the near perfect frequency response shown in screenshot 2, this filter was designed by Matlab's Filter Design App in the Signal Processing utility. The oscillator given by this filter is shown in screenshot 3,  Only smooth curving lines are visible, there is no information about trend. But notice how much lagging this oscillator is relative to the price itself. It has a perfect momentum oscillator shape, but it is useless because of the large lag. Those who try to read  the trend from a momentum oscillator are milking the sickly cow. (This does not apply to my Biquad High Pass Filter , whose purpose is to accentuate divergences and small/medium range trends, or to the RSI for example, because the RSI is not a momentum oscillator as erroneously considered, but is a high pass filter detrender).

4. Because trend-following is meaningless for a momentum oscillator, and because all tops and bottoms should disappear in a good oscillator, then it follows that following divergences is not a good practice. Again, here one is trying to read from undiscarded refuse.

5. Does the slope of a moving average indicate momentum ?  Yes !  But the moving average (or low pass filter) must satisfy the crucial condition of having flat pass-bands in its magnitude frequency response. For example, none of the  standard averages  SMA, EMA or LWMA have flat passbands. If you have the time, please install and play with my  Quick n Dirty Frequency Response indicator

The take from this discussion is this: Only zero crossings and oscillator value reversals have a well established meaning. If the momentum oscillator is of high quality (i.e.  linear frequency rise, low noise, and low lag.), then  it becomes an effective tool for trading.


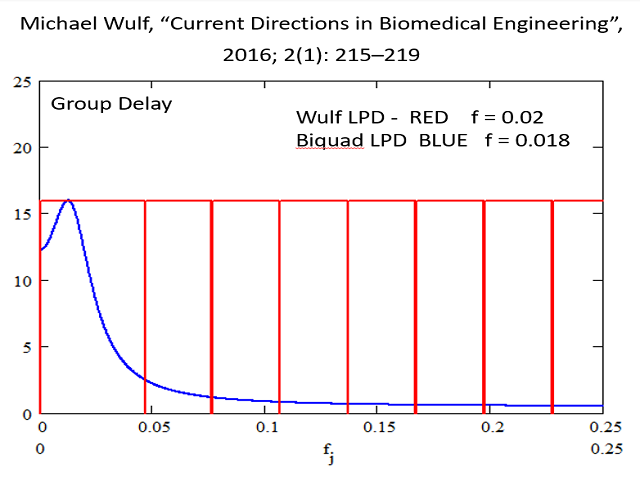
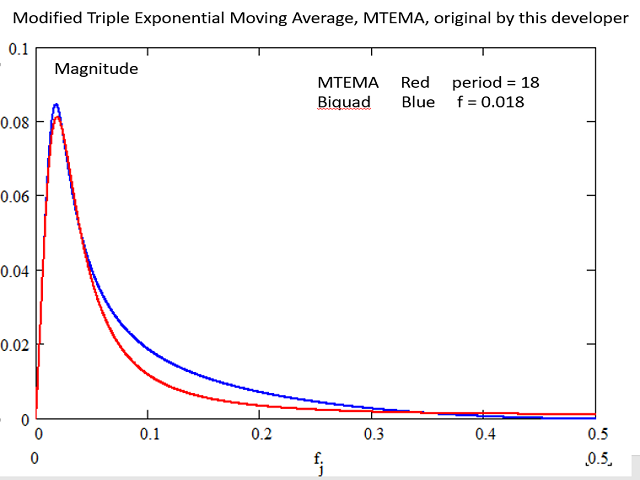
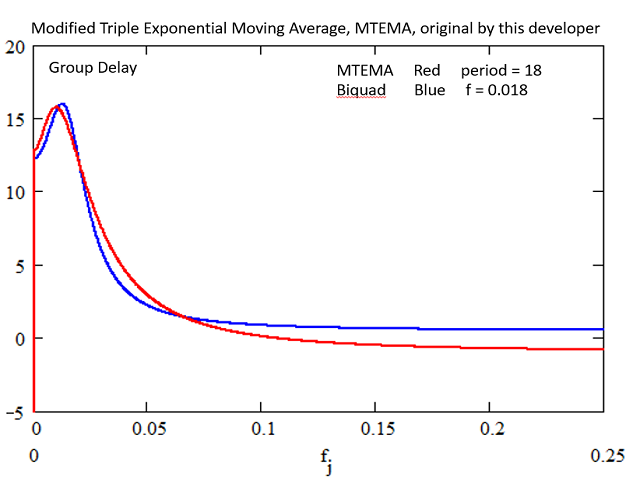
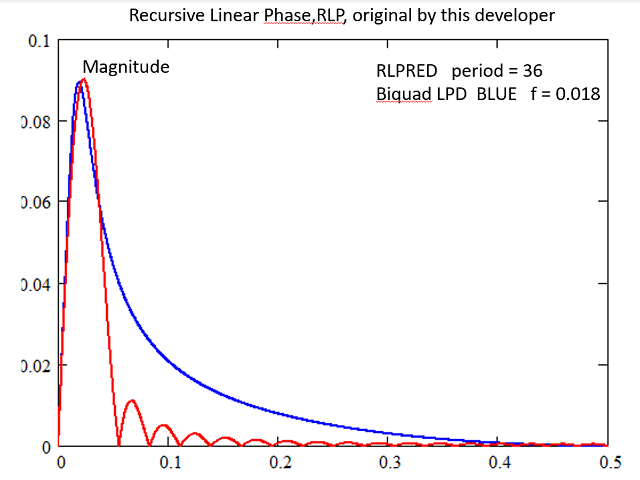
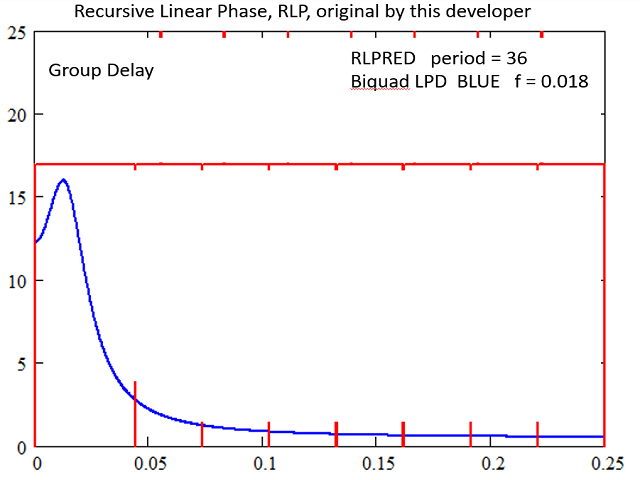
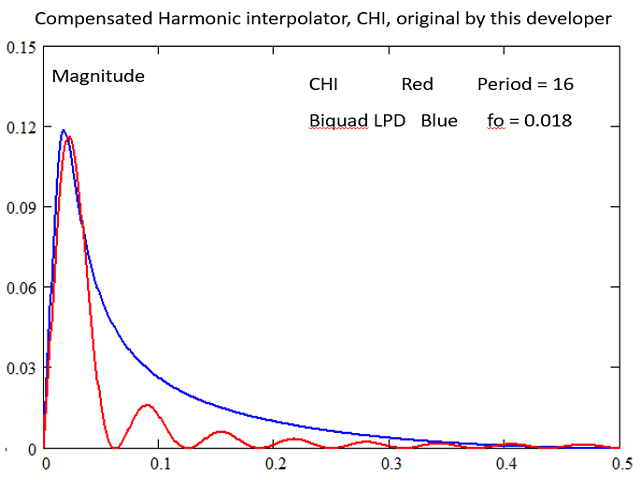
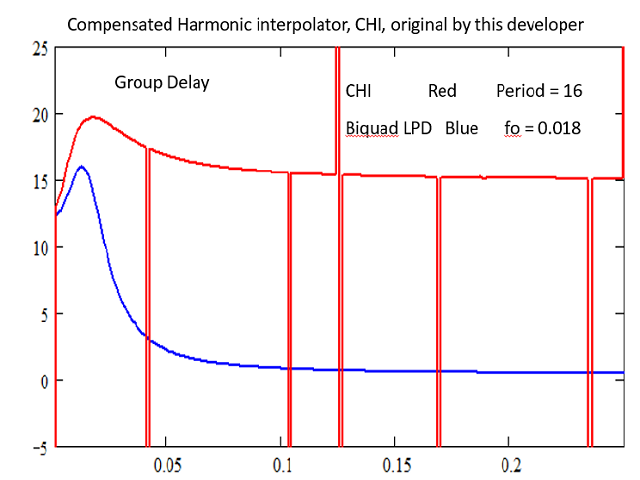
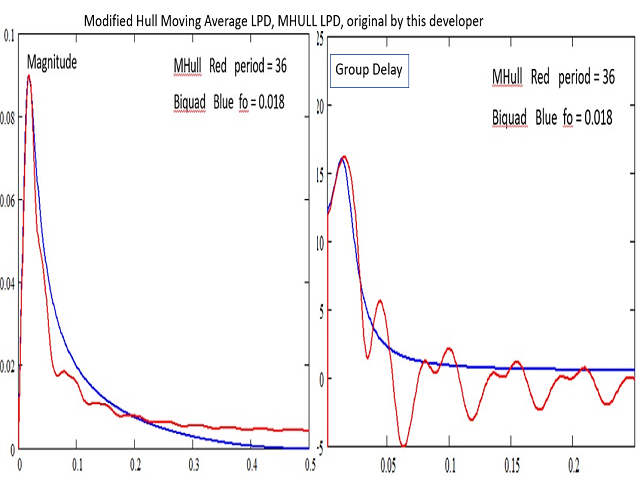
In presenting the momentum oscillators of this indicator, we will use the Biquad LPD as a reference for comparison. The screen shots display the magnitude and group delay response of each of the oscillator of this indicator compared to the reference biquad. All periods and settings are selected to give a response similar to the MACD(12,26). But the  actual best parameters  for each filter are of course a subject of optimisation. The response of the MACD and Awesome oscillator have been disclosed in my previous product True Momentum

Now !  Which one is best ?!  Obviously, they are all superior to MACD and Awsome oscillator at suppressing high frequency volatility. And this does not come at a cost in lag.  However, when the five are compared to each other, a trade off is seen. Maybe MTEMA offers the best plot compared with the biquad. But my personal favorites are WULF's and my own Recursive Linear Phase. These are the only two possessing a linear phase response (straight GD line). This is a requirement for a perfect reconstruction of momentum.

CAUTION: Please know there is a great difference between having a good trading tool, and actually winning trades based on its signals.

And trade only with money you can spare losing.  Good Luck !


レビュー 4
Artialberta
730
Artialberta 2025.04.03 15:55 
 

Intéressant.

lisi 7887
1724
lisi 7887 2023.02.17 16:05 
 

Thank you! You are the best!!!

おすすめのプロダクト
Stable Helper – Keep Your Trading Connection Uninterrupted! Ensure your MT4 stays connected and stable automatically! Stable Helper works silently in the background, monitoring your connection, rescanning servers, and even restarting MT4 if necessary—all without manual intervention. Designed to minimize downtime and optimize server performance , Stable Helper protects your trades from unexpected disconnections and latency issues. Key Features: 1️⃣ Real-Time Connection Monitoring Constantly
FREE
Sessions Killzone MT4
Wafa Mohammed Omar Abou Alwafa
3.5 (2)
Session Killzone Indicator Indicator that helps you to identify the killzone times of both London and NewYork sessions which usually is the most times for high volatility and taking liquidity from the market. Killzone times are configurable through indicator parameters. The indicator adjusts the range of the killzones based on the daily trading range.
FREE
It's a variation of mid of HH and LL since it compares the higher of HH or LL against a period and twice the number of bars back to avoid whipsaws. I used to display this against lines on a chart, but made a histogram out of it and it looks interesting. It looks good at gauging trend strength and general turns (see image below). The name of the indicator is BAM, which is an acronym for "Below and Above Mid". Ways to use it: 1. To see general trend on longer TFs (more than 60 bars back).
説明 Triangle Breakout Retest Dashboard Pro Multi Symbol は、マーケットストラクチャーに基づいたブレイクアウトおよびリテスト取引のために設計されたマルチ通貨ペア対応のインスティテューショナル型インジケーターです。 複数の通貨ペアを自動的にスキャンし、三角持ち合いパターンを検出し、ブレイクアウトの方向を特定し、リテストが確認されるまでエントリーシグナルを生成しません。 このツールは、マーケット構造に基づいた確認エントリーに集中することで、フェイクブレイクアウトを回避するために設計されています。 主な機能 三角形パターン検出 上昇三角形を自動検出 下降三角形を自動検出 対称三角形を自動検出 視覚的確認のためにトレンドラインを描画 ブレイクアウト検出エンジン 有効な構造ブレイクアウトを検出 市場の方向性(上昇または下降)を決定 ブレイクアウトレベルを記録 リテスト確認システム 価格がブレイクアウトレベルに戻るのを待機 価格反応を確認してからエントリー フェイクシグナルを大幅に削減 買いリテスト確認シグナルを生成 売りリテスト確認シグナルを生
ZobGoldV7-PRO —— プロ仕様の SMC ゴールド自動取引システム 「個人投資家の罠を抜け出し、機関投資家の視点へ」 なぜ 多 くのゴールドトレーダーは 資金 を 失 うのか ? それは 、 ノイズに 惑 わされているからです 。 ZobGoldV7-PRO は 、 スマートマネーコンセプト ( SMC ) に 基 づき 、 ゴールド ( XAUUSD ) の H4 周期 に 特化 して 開発 された 究極 の 自動取引 システムです 。 6 年間 の 実績: 2020 年 から 2025 年 までの 激動 の 相場( コロナ 禍、地政学 リスク 、 インフレ ) を 勝 ち 抜 き 、年平均利回 り 22% を 維持。 3 段階 レイヤー 戦略: 独自 のアルゴリズムによる 「 3 段階分層 エントリー 」 を 採用。機関投資家 のようなコスト 平均化 を 行 い 、大 きなトレンドを 逃 しません 。 徹底 したリスク 管理: ナンピンやマーチンゲールは 一切 なし 。 ATR 動的 トレーリングストップと 最大 8.0 の 損益比( RR ) を 追求 するロジックを
A   rocket   (from   Italian :   rocchetto ,   lit. 'bobbin/spool') [nb 1] [1]   is a   projectile   that   spacecraft ,   aircraft   or other   vehicles   use to obtain   thrust   from a   rocket engine . Rocket engine exhaust is formed entirely from   propellant   carried within the rocket. [2]   Rocket engines work by   action and reaction   and push rockets forward simply by expelling their exhaust in the opposite direction at high speed, and can therefore work in the   vacuum   of space. In
Magic Card: 魔法カードを持っているなら、なぜ自分で魔法を学ぶ必要があるの? アブラカダブラ~ シャザム~ 実現せよ! ねえ、Magic Cardを聞いたことある?これは手品師のトリックじゃない——本物の 市場魔法カード だよ! まだ手動で取引してるの?2026年だよ、魔法に働いてもらう時が来た! 他の人たちがまだ「トレーディング聖書」を勉強している間に、あなたに必要なのはクリック一つ—— Magic Card が魔法をかけ始める! これは手品師じゃない、あなたの「ポケットサイズ魔法カード」 従来の取引 : 100の指標を学ぶ + チャートを見て睡眠不足 + 精神的な葛藤 = お金を稼げるかも Magic Card : カードを挿入 → 起動 → 市場に踊らせる = 自動的に利益を得る ミシュラン星レストランの料理を楽しむのにシェフになる必要がないのと同じ——市場から利益を得るのにトレーディングの達人になる必要はないんだ! Magic Cardの3つの「魔法の瞬間」 1.   「時間魔法」——チャートを見つめる時間を人生の時間に戻す   → 以前の
The UNIVERSAL DASHBOARD indicator will eliminate the need of using dozens of indicators on dozens of charts. From one place you can monitor all the pairs and all the timeframes for each of the following indicators: MACD STOCHASTIC WPR RSI CCI You can also use any Custom indicator in the dashboard as long as it has a readable buffer. With a single click you can quickly navigate between charts, pairs and timeframes. Alerts will provide clear indication about what happens for your favorite pairs on
FREE
Crystal CopyCat Ultimate Ultra-Fast Master–Slave Copier with Zero-Delay Execution and Cross-Platform MT5 Compatibility Architecture: MT4 → MT4 and MT4 → MT5 Full Compatibility MT4 Pro :- https://www.mql5.com/en/market/product/165057 MT5  Free Version: https://www.mql5.com/en/market/product/144569 Complete User Setup Guide:-  https://www.mql5.com/en/blogs/post/764222   1. Overview Crystal CopyCat Ultimate 5.0 is a next-generation trade copy engine engineered for professional traders, portfo
FREE
Zenith Aquarius Booster A Refined Strategy Engine for BTCUSD Most Expert Advisors on the market fall into one of two traps: they are either over-optimised to historical data and fail in live conditions, or they rely on grid and martingale recovery logic that averages deeper into losing positions. Zenith Aquarius Booster takes a different approach. Instead of offering dozens of loosely tested combinations across many symbols, Aquarius Booster is specifically engineered for BTCUSD — a market known
Jerk Indicator
Safwan Rushdi Khalil Arekat
5 (1)
In physics, "Jerk" is the third time-derivative of position, with acceleration being the second derivative and velocity the first derivative. In technical analysis, the first derivative of price is the price momentum, with the second derivative,acceleration, being seldom used and the third derivative virtually unknown. The magnitude frequency response of a digital differentiator is a positive-slope straight line passing through zero frequency. Therefore, every instance of a digital signal differ
FREE
CANDLE TIMER: 直感的なキャンドル締め切り通知通知 CANDLE TIMERは、トレーダーが現在のチャートのキャンドルが終了するまでの残り時間をリアルタイムで確認するのに役立つ重要な補助指標です。特に、ダンタの売買やボラティリティの高い市場での正確な参入と清算のタイミングを把握するのに非常に便利です。 ※レビューとコメントスコアをいただくとプログラムを作業するのに大きな力になります。ありがとうございます。 コア機能: リアルタイムカウントダウン:現在のキャンドルの締め切りまで残った分と秒をリアルタイムで表示します。 動的位置調整:現在の価格に沿って移動してチャートの読みやすさを最大化します。 キャンドルカラーインターロック:キャンドルの性質(養蜂/陰棒)に応じて、カウントダウンボックスの背景色が自動的に変更され、視覚的な地図が上がります。 養蜂(上昇):緑色の背景で白い文字 陰茎(下落):赤の背景に白い文字 CANDLE TIMERを使用する利点: 心理的安定感:キャンドルの締め切りを正確に把握することで、急な進入を防ぎ、心理的安定を維持することができ
FREE
Zenith Aquarius Standard Most Expert Advisors on the market fall into one of two traps: they are either over-optimised to historical data and fail in live conditions, or they rely on grid and martingale recovery logic that averages deeper into losing positions. Zenith Aquarius takes a different approach. Zenith Aquarius Standard is an Expert Advisor designed for MetaTrader 4 and BTCUSD trading conditions. The product includes five predefined strategy configurations. Each configuration uses a dif
FREE
This indicator does not process the price chart data and does not provide trading signals. Instead, it is  an application to compute and display the frequency response of many conventional indicators. Moving averages like the SMA, LWMA and EMA, and  oscillators like the MACD, CCI, Awsome Osc, all have the form of digital filters. Electronic engineers use a special method to characterise the performance of these filters by studying their frequency response. Two important quantities of the freque
FREE
WK Trade EA
Abdulkareem Sultan Hasan Saleh
Sale ends on 09/09/2023   Note: Trading is dangerous and you can lose all your money. This is a warning  Good brevity makes sense .... It is a simple and smart expert that monitors the intraday market movements and enters with the market makers  Recommendations Test with minimal risk first Use a VPS whose location is close to the server location of the broker you are working with. Use a leverage of 1:100 or more Use    ECN   Account +     Stop Levels == 0  +   Low   spread +   Low   commission +
Chart Local Time
Rider Capital Group
4.86 (14)
Display your Local Time on your charts Display your local time   instead of (or along with) MT4 server time. Display crosshair   which highlights current candle time. Automatically adjusts based on chart zoom (zooming in or out). Displays on every timeframe (M1 – Month), and auto-adjusts as chart timeframe is changed. Handles special ½ hour time zones , such as India.  Renders   fast   (no lag) as you scroll charts. Customize the font family, font size, background color, and crosshair col
FTC Neuro
Aliaksandr Ausiyevich
革新的な取引ソリューションの世界へようこそ ! 私たちは、最新のマクロ経済統計と現代のニューラルネットワーク計算に基づいて取り組んで、あなたの注意に私たちの高度な取引顧問FTCニューロを提示 複雑なアルゴリズムの助けを借りて市場の状況を分析すると、アドバイザーは高度な人工知能アルゴリズムを使用して経済情報の隠されたパターンを認識します。 それはあなたの取引を入力し、終了するためのユニークなポイントを提供し、最も専門的な取引の経験を提供しています。 高品質の取引は常にリスクと利益のバランスであることは誰もが知っています。 私たちは独自のリスク管理システムを開発し、私たちの顧問は慎重にあなたの資本を安全に保つためにそれらを管理しています。 あなたの取引戦略を自動化し、私たちのFTCニューロ取引アドバイザーと複雑な意思決定を簡素化! リスクを最小限に抑え、あなたの資本を増やす機会を得る! そして、このすべて-将来的に快適さと自信を持って。 今日私たちの取引アドバイザーを試してみて、プロと高品質の取引の世界に身を浸し! 顧問の仕事では、マクロ経済統計による動きの方向の計算とニューラルネットワ
Zero hour runner
Cosmas Akamadu Nwachukwu
Buy the unlimited version and get free 6 Months Zero hour Runner Expert Advisor valued at $99,  here:  https://www.mql5.com/en/market/product/176118   Introducing: ZERO HOUR RUNNER NON-REPAINT indicator    SHORT     PRECISE  &  NOISELESS A system engineered around one principle: Clarity + Timing + Discipline = Consistency  What Makes ZERO HOUR RUNNER Different? No Repainting. No Tricks. Signals do NOT repaint, redraw, or recalculate What you see is exactly what you get—even after refresh
Hello friends. I wrote this utility specifically for use in my profile with a large number of Expert Advisors and sets ("Joint_profiles_from_grid_sets" https://www.mql5.com/en/blogs/post/747929 ). Now, in order to limit losses on the account, there is no need to change the "Close_positions_at_percentage_of_loss" parameter on each chart. Just open one additional chart, attach this utility and set the desired percentage for closing all trades on the account. The utility has the following function
This indicator shows the breakeven line level for the total number of open positions of the current symbol with P/L value and total volume. This indicator is helpful to decide the exit level when using a trading grid strategy. The style of the breakeven line is customizable to choose the color, line shape and font size of the positions description. Send mobile notification when crossing a positive P/L target
FREE
Liquidity Sentinel Pro – マルチ時間軸ダッシュボード&ヒゲ反発アラート 説明: Liquidity Sentinel Pro は、MT4 用の強力なオールインワンインジケーターで、マルチタイムフレームのトレンド分析、需給の強さ、精密なヒゲ反発アラートを組み合わせて、トレーダーに市場の動向を総合的に把握させます。 このツールは、どの通貨ペアや資産がトレンド中かを示し、高確率の反転ポイントをハイライトし、市場のノイズをフィルタリングして、トレーダーが市場の勢いに沿った取引を自信を持って行えるようにサポートします。 主な機能: マルチタイムフレームトレンドダッシュボード 選択可能な2つの時間軸(例:H4 と M30)のトレンド方向を表示。 強い整合性に基づき、買い(BUY)または売り(SELL)のチャンスを迅速に特定。 ダッシュボードのアラートで、取引準備が整ったペアを知らせます。 需給ヒストグラム 買い(需要)と売り(供給)の強さを視覚的に表示。 2つの独立した時間軸で勢いを追跡し、市場の全体像を明確に。 過剰な動きや反転の可能性があるゾーンを特定するのに役立ちます
CHF Portal is designed for Trading USDCHF specifically. Trading Concept The operation concept of CHF Portal is based on an algorithm which tries to determine the Trend. To be more specific, CHF Portal works with its own calculation logic according to historical volatility and price movement. It is trying to find out the Top or Bottom in a Trend, and open the Short or Long Position accordingly. Don't expect CHF Portal can be able to open the trade on the highest or lowest level, because CHF Port
Delving deep into the sphere of finance and trading strategies, I decided to conduct a series of experiments, exploring approaches based on reinforcement learning as well as those operating without it. Applying these methods, I managed to formulate a nuanced conclusion, pivotal for understanding the significance of unique strategies in contemporary trading.  
FREE
Buy & Sell Levels with Alerts is a comprehensive trading indicator that combines Stochastics, Previous Day Levels, Multi-Timeframe (MTF) Trend Meter , and rejection detection into one powerful tool. It helps traders quickly spot key support/resistance zones, trend direction, and high-probability reversal signals with visual arrows and automated alerts. Key Features: Stochastic Oscillator: Displays fast (%K) and slow (%D) lines in a separate window. Helps identify overbought and oversold conditio
BTC Miner Pro   EA works on Time and Price theory. As the price patterns change, there will be no difference in performance of the EA, which is why this system has long-term stability and performance. The EA finds important and valuable price and executes trades based on them. This system works 100% automatically. Suitable for   BITCOIN   or   BTCUSD . MT5 :  https://www.mql5.com/en/market/product/149982 Public channel :  https://www.mql5.com/en/channels/mqlexp Note : If you have any problem
This indicator provides trading signals based on the polarity of the dynamical parameters of two digital signals. The dynamical parameters (momentum-acceleration) are derived by applying a high quality momentum oscillator, MTEMA LPD ( see Top Gun Oscillators ) to two digital signals. The MTEMA momentum oscillator is first applied to the price itself. Then, a rectification procedure is applied to the price based on the signals from the momentum oscillator yielding a rectified price signal. This s
FREE
Chemical rockets   are the most common type of high power rocket, typically creating a high speed exhaust by the   combustion   of   fuel   with an   oxidizer . The stored propellant can be a simple pressurized gas or a single   liquid fuel   that disassociates in the presence of a catalyst ( monopropellant ), two liquids that spontaneously react on contact ( hypergolic propellants ), two liquids that must be ignited to react (like kerosene (RP1) and liquid oxygen, used in most   liquid-propella
FREE
Smart Bulls MT4
Mostafa Saad Saeed Shawara
製品名 Smart Bulls (MT4) – SmartView シリーズ 短い説明 MetaTrader プラットフォームで独特なユーザー体験を提供する Bulls インジケーター。以前は利用できなかった高度な機能を提供し、ダブルクリックで設定を開く、削除せずにインジケーターを非表示/表示する、インジケーターウィンドウをチャート全体のサイズで表示するなどの機能を備えています。SmartView Indicators シリーズの残りの部分とシームレスに連携するように設計されています。 概要 SmartView シリーズは、革新的な機能を通じて MetaTrader プラットフォーム上のインジケーターに独特で特徴的なユーザー体験を提供し、インジケーター管理をより速く、より簡単にします。各インジケーターには、チャート上のスマートコントロールパネルが装備されており、基本情報を表示し、すべての重要な機能への迅速なアクセスを提供します。 以前は利用できなかった独自の機能 SmartView シリーズは、インジケーターでの作業をより簡単で迅速にする高度な機能を提供します: ダブルクリックで設定を
FREE
Dynamic Range Indicator for MQL4 Introducing our cutting-edge Dynamic Range Indicator , specifically designed for 5-minute charts, featuring a proven back-testing record to ensure reliable performance. Key Features: Blue and Red Lines: The indicator uses two dynamic lines to represent market volatility. Calculation Method: The lines are constructed using the last 14 days' average absolute movement of 5-minute closing prices, multiplied by today's session open price. Indicator Formula: Today's op
History Exporter can help to export your orders history from MT4 account. After that you can use another data analysis tools to get what you want.  File format is .csv file, the content such as below OrderID,Symbol,Type,Lots,OpenTime,OpenPrice,StopLoss,TakeProfit,CloseTime,ClosePrice,Commission,Swap,MagicNo,Comment,ProfitUSD,ProfitPips,NetProfit,Duration,(Days),(HH:MM:SS), 21520206,EURCHF,buy,0.05,2020.03.10 08:06:15,1.06304,0.00000,0.00000,2020.03.11 13:37:38,1.06015,-0.60,-0.05,28282888,RedRab
FREE
このプロダクトを購入した人は以下も購入しています
Genesis Matrix Pro is a professional multi-timeframe trend detection indicator designed to help traders identify high-quality market alignment with clarity and structure. It combines 12 different technical indicators into one visual alignment matrix, allowing traders to quickly see when market conditions are bullish, bearish, or neutral. A signal is generated only when the selected strategies are aligned, helping reduce noise and improve decision-making. PLEASE CONTACT ME AFTER PURCHASE TO GET
Gann Made Easy は、ミスター・ギャンの理論を使用した取引の最良の原則に基づいた、プロフェッショナルで使いやすい外国為替取引システムです。 W・D・ガン。このインジケーターは、ストップロスとテイクプロフィットレベルを含む正確な買いと売りのシグナルを提供します。 PUSH通知を利用して外出先でも取引可能です。 ご購入後、取引方法の説明と優れた追加インジケーターを無料で入手するには、私にご連絡ください! おそらく、ギャンの取引手法についてはすでに何度も聞いたことがあるでしょう。通常、ギャンの理論は初心者のトレーダーだけでなく、すでにある程度の取引経験がある人にとっても非常に複雑なものです。なぜなら、ギャンの取引手法は理論的にはそれほど簡単に適用できるものではないからです。私はその知識を磨き、最良の原則を私の外国為替インジケーターに組み込むために数年を費やしました。 このインジケーターは非常に簡単に適用できます。必要なのは、それをチャートに添付し、簡単な取引推奨事項に従うだけです。このインジケーターは常に市場分析の仕事を行い、取引の機会を探します。適切なエントリーポイントを検出す
The Propfolio Master Suite is the ultimate all-in-one analytical workstation for professional traders. Combining the power of the Beat The Market Maker (BTMM) methodology, Smart Money Concepts (SND/Liquidity), and Advanced Volume Profile, this suite replaces multiple different indicators with one optimized engine. Monitor up to 14 pairs simultaneously from a single chart, instantly identify market cycles, and seamlessly map institutional footprints with the click of a button. The Command Center
Scalper Inside PRO Scalper Inside PRO は、MetaTrader 4 向けの短期トレンドおよびスキャルピング用インジケーターです。独自アルゴリズムを用いて、市場の方向性と主要なターゲットレベルを素早く検出します。エントリー、イグジット、複数の利確ターゲットを自動計算し、詳細なパフォーマンス統計を表示することで、さまざまな銘柄やストラテジーがどのように機能してきたかを確認できます。これにより、現在のマーケットコンディションに最も適した取引銘柄を選択するのに役立ちます。さらに、Scalper Inside PRO には、お使いの矢印インジケーターを簡単に接続でき、その統計と過去のパフォーマンスを素早く評価できます。 本インジケーターは、あらゆる銘柄と時間足で動作し(短期トレードには M5 を推奨)、複数の内蔵ストラテジーを備えています。そのため、単体のスキャルピングツールとしても、トレーディングシステム内の強力な分析コンポーネントとしても活用できます。 主な機能 独自アルゴリズム(Next‑Generation Trend Detection Algor
M1 SNIPER は使いやすいトレーディングインジケーターシステムです。M1時間足向けに設計された矢印インジケーターです。M1時間足でのスキャルピングのためのスタンドアロンシステムとして、また既存のトレーディングシステムの一部としても使用できます。このトレーディングシステムはM1時間足での取引に特化して設計されていますが、他の時間足でも使用できます。元々、この手法はXAUUSDとBTCUSDの取引用に設計しましたが、他の市場においても役立つと考えています。 インジケーターのシグナルは、トレンドの方向と逆方向に取引できます。インジケーターのシグナルを利用して両方向に取引するのに役立つ特別な取引テクニックをご紹介します。この手法は、特別な動的なサポートとレジスタンスの価格帯を利用することに基づいています。 ご購入後、M1 SNIPER矢印インジケーターをすぐにダウンロードできます。さらに、M1 SNIPERツールのすべてのユーザーに、以下のスクリーンショットに表示されているApollo Dynamic SRインジケーターを無料で提供しています。この2つのインジケーターを組み合わせることで
PRO Renko Systemは、特別にRENKOチャートを取引するために設計された高精度の取引システムです。 これは、様々な取引商品に適用することができる普遍的なシステムです。 システムは効果的に正確な逆転信号へのアクセスを与えるいわゆる市場の騒音を中和する。 表示器は非常に使いやすく、信号の生成に責任がある1つの変数だけがあります。 あなたは簡単にお好みの任意の取引ツールとレンコバーのサイズにツールを適応させることができます。 私はいつもあなたが私のソフトウェアで収益性の高い取引を支援するために余分なサポートを提供する準備ができています! 私はあなたに幸せで収益性の高い取引をしたいです! ご購入後にご連絡ください! 私はあなたに私のレンコチャートジェネレータを送信します。 私はまた、私の個人的な推奨事項やシステムの他のモジュールを無料で共有します!
NAM Order Blocks
NAM TECH GROUP, CORP.
3.67 (3)
MT4マルチタイムフレームオーダーブロック検出インジケーター。 特徴 -チャートコントロールパネルで完全にカスタマイズ可能で、完全な相互作用を提供します。 -必要な場所でコントロールパネルを表示および非表示にします。 -複数の時間枠でOBを検出します。 -表示するOBの数量を選択します。 -さまざまなOBユーザーインターフェイス。 -OBのさまざまなフィルター。 -OB近接アラート。 -ADRの高線と低線。 -通知サービス(画面アラート|プッシュ通知)。 概要 注文ブロックは、金融機関や銀行からの注文収集を示す市場行動です。著名な金融機関と中央銀行が外国為替市場を牽引しています。したがって、トレーダーは市場で何をしているのかを知る必要があります。市場が注文ブロックを構築するとき、それは投資決定のほとんどが行われる範囲のように動きます。 注文の構築が完了すると、市場は上向きと下向きの両方に向かって急激に動きます。注文ブロック取引戦略の重要な用語は、機関投資家が行っていることを含むことです。それらは主要な価格ドライバーであるため、機関投資家の取引を含むあらゆる戦
まず第一に、この取引ツールはノンリペイント、ノンリドロー、ノンラグの指標であり、プロの取引に理想的ですことを強調する価値があります。 オンラインコース、ユーザーマニュアル、デモ。 スマートプライスアクションコンセプトインジケーターは、新米から経験豊富なトレーダーまで、非常 に強力なツールです。Inner Circle Trader AnalysisやSmart Money Concepts Trading Strategiesなど、20以上の有用な指標を1つに組み合わせています。このインジケーターはスマートマネーコンセプトに焦点を当て、大手機関の取引方法を提供し、彼らの動きを予測するのに役立ちます。 特に、流動性分析に優れており、機関がどのように取引しているかを理解しやすくしています。市場のトレンドを予測し、価格の動きを慎重に分析するのに優れています。機関の戦略とトレードを合わせることで、市場の動向についてより正確な予測ができます。このインジケーターは多目的であり、市場構造を分析し、重要な注文ブロックを特定し、さまざまなパターンを認識するのに優れています。 このインジケーターは
LHおよびHLブレイクアウトを見つけるための純粋な価格アクションによって行われる高度な計算。 それはあなたに市場で素晴らしい逆転ポイントを与えるでしょう。LHとHL信号は同様にトレイングルブレイクアウトに使用することができます。 ブレイクアウトが発生すると、強い反転を示します。移動平均の優れたフィルターです。トレンドインジケーターと一緒に使用することを強くお勧めします。 サポートとレジスタンス、供給需要指標の追加確認として使用できます。 詳細については、次の外国為替スレッドをご覧ください。 インジケーターは再描画されていません。 Buffers :   SetIndexBuffer ( 0 ,UpBar);      SetIndexBuffer ( 1 ,UpBar2);           SetIndexBuffer ( 2 ,DnBar);      SetIndexBuffer ( 3 ,DnBar2);           SetIndexBuffer ( 4 ,UpBarTop);      SetIndexBuffer ( 5 ,UpBarLow);     
Dynamic Forex28 Navigator - 次世代の Forex 取引ツール。 現在 49% オフ。 Dynamic Forex28 Navigator は、長年人気のインジケーターを進化させたもので、3 つの機能を 1 つにまとめています。 Advanced Currency Strength28 インジケーター (レビュー 695 件)  + Advanced Currency IMPULSE with ALERT (レビュー 520 件) + CS28 コンボ シグナル (ボーナス)。 インジケーターの詳細 https://www.mql5.com/en/blogs/post/758844 次世代の Strength インジケーターが提供するもの  オリジナルで気に入っていたすべての機能が、新機能と精度の向上によって強化されました。 主な機能: 独自の通貨強度計算式。 すべての時間枠でスムーズかつ正確な強度ライン。 トレンドの特定と正確なエントリーに最適です。 ダイナミックマーケットフィボナッチレベル (マーケットフィボナッチ)。 このインジケーターに固有
Auto Optimized Parabolic RSI: 高度な3Dモメンタムエンジン ほとんどのリテール向けインジケーターは、市場のボラティリティが変化した瞬間に破綻する静的な入力値に依存しているため、失敗に終わります。Auto Optimized Parabolic RSIは、自らの数学的優位性を継続的に再計算することで「インジケーターの陳腐化」問題を解決し、機関投資家レベルの定量的適応力をMT5ターミナルに直接もたらします。 最大の強み: カスタムインメモリ3D最適化   標準的な自動最適化ツールは、インジケーターの呼び出しで端末に過負荷をかけるため、頻繁にMT5プラットフォームをフリーズさせます。本ツールは、このボトルネックを完全に回避しています。RAMベースのカスタムネイティブ計算機を内蔵した内部エンジンは、チャートを読み込んだりタイムフレームを変更したりするたびに、超高速の3Dグリッド探索を実行します。RSI期間(頻度)、SARステップ(加速度)、SAR最大値(制限速度)を同時にスイープし、プラットフォームを遅延させることなく、数万通りものパラメーターの組み合わせを絶対的
このインジケーターは、反転ポイントと価格戻りゾーンを正確に表示します。     主要プレーヤー 。新たなトレンドが形成される場所を把握し、最大限の精度で意思決定を行い、すべての取引をコントロールします。 TREND LINES PRO インジケーターと組み合わせることで、その潜在能力を最大限に発揮します。 VERSION MT5 インジケーターが示す内容: 新しいトレンドの始まりに活性化する反転構造と反転レベル。 リスクと報酬の比率を最小限に抑えた利益 確定 と 損失停止の レベルの表示     RR 1:2   。 インテリジェントな削減ロジックによるストップロス。 指定されたインジケーターから 2 つのトレンド タイプの反転パターンを表示します。 指標: トレンドを追う   TREND LINES PRO   (世界的なトレンドの変化) TREND PRO   (クイックトレンド変更) シンプルで効果的   スキャナー   リアルタイムトレンド(新機能)。 マルチタイムフレームのインストゥルメント フィルタリング。 画面   利益     LOGIC AI信号の後。 当日プラス方
トレンドキャッチャーインジケーター トレンドキャッチャーインジケーターは、開発者独自の適応型トレンド分析指標を組み合わせることで、市場価格の動きを分析します。短期的なノイズを除去し、根底にあるモメンタムの強さ、ボラティリティの拡大、価格構造の挙動に焦点を当てることで、真の市場方向性を特定します。また、移動平均線、RSI、ボラティリティフィルターなどの平滑化およびトレンドフィルタリング機能を備えたカスタマイズ指標も使用します。 実際の運用状況のモニタリングやその他の製品については、こちらをご覧ください: https://www.mql5.com/en/users/mechanic/seller ご注意ください。私はTelegramでEAや設定を販売していません。詐欺です。すべての設定はブログで無料で公開しています。 重要!ご購入後すぐにご連絡ください。手順とボーナスをお送りします!
Apollo SR Master は、サポート/レジスタンスゾーンを利用した取引をより容易かつ確実にする特別な機能を備えたサポート/レジスタンスインジケーターです。このインジケーターは、ローカル価格の高値と安値を検出することで、タイムラグなしでリアルタイムにサポート/レジスタンスゾーンを計算します。そして、新たに形成されたSRゾーンを確認するために、インジケーターは特別なシグナルを表示します。このシグナルは、SRゾーンを実際の売りまたは買いシグナルとして考慮して使用できることを示します。この場合、SRゾーンの強度が高まり、SRエリアからの取引が成功する確率も高まります。これがこのインジケーターの基本的な考え方です。 SRゾーンは、ストップロスとテイクプロフィットの設定を容易にします。シグナルの方向に応じて、SRゾーンの上または下のスペースをストップロスとして設定できます。さらに、反対側のSRゾーンは、潜在的なテイクプロフィットエリアとして設定できます。 また、Apollo SRマスターインジケーターをご利用のすべてのユーザーには、「Apollo Price Action System」
優れたテクニカルインジケーター「Grabber」をご紹介します。これは、すぐに使える「オールインワン」トレーディング戦略として機能します。 ひとつのコードに、市場のテクニカル分析ツール、取引シグナル(矢印)、アラート機能、プッシュ通知が強力に統合されています。 このインジケーターを購入された方には、以下の特典を無料で提供します: Grabberユーティリティ:オープンポジションを自動で管理するツール ステップバイステップのビデオマニュアル:インジケーターのインストール、設定、取引方法を解説 カスタムセットファイル:インジケーターをすばやく自動設定し、最大限の成果を出すための設定ファイル 他の戦略はもう忘れてください!Grabberだけが、あなたを新たなトレードの高みへと導いてくれるのです。 Grabber戦略の主な特徴: 推奨タイムフレーム:M5〜H4 対応通貨ペア・資産:どれでも使用可能ですが、私が実際に検証した以下を推奨します(GBPUSD、GBPCAD、GBPCHF、AUDCAD、AUDUSD、AUDSGD、AUDCHF、NZDUSD、NZDCAD、EURCAD、EURUSD、E
Advanced Supply Demand
Bernhard Schweigert
4.91 (300)
現在40%オフ 初心者にもエキスパートトレーダーにも最適なソリューション このインジケーターは独自の機能と新しい公式を多数内蔵しており、ユニークで高品質かつ手頃な取引ツールです。このアップデートでは、2つの時間枠ゾーンを表示できるようになります。より長いTFだけでなく、チャートTFとより長いTF(ネストゾーンを表示)の両方を表示できます。すべてのSupply Demandトレーダーの皆さんのお気に召すはずです。:) 重要情報の公開 Advanced Supply Demandの可能性を最大化するには、 https://www.mql5.com/ja/blogs/post/720245 にアクセスしてください。   エントリーまたはターゲットの正確なトリガーポイントを正確に特定できれば取引がどのように改善されるか想像してみてください。新しい基盤となるアルゴリズムに基づいて構築されているため、買い手と売り手の間の潜在的な不均衡をさらに簡単に特定できます。これは、最も強い需要と供給のゾーンと、過去のパフォーマンス(古いゾーンを表示)がグラフィカルに表現されるためです。これらの機能は、最適な
ゴールドラッシュ・トレンド・アロー・シグナル ゴールドラッシュ・トレンド・アロー・シグナル 指標は、XAU/USDにおける高速・短期スキャルパー向けに最適化された、正確でリアルタイムのトレンド分析を提供します。 1分足専用に設計されたこのツールは、明確なエントリーポイントを示す方向矢印を表示し、スキャルパーが変動の激しい市場状況でも自信を持って取引できるよう支援します。 この指標は、PRIMARY(主要)とSECONDARY(補助)のアラート矢印で構成されています。PRIMARYシグナルは、トレンドの方向転換を示す白と黒の方向矢印であり、SECONDARYシグナルは、PRIMARY矢印が示す方向を確認し、潜在的なエントリーポイントを示す青と赤の矢印です。 注意:トレンド方向の変化後にPRIMARYアラート矢印が1つだけ表示される場合、複数のSECONDARY青/赤矢印が表示される点に注意が必要です。SECONDARYシグナルは、シグナル基準を満たす任意のローソク足後に表示されます。したがって、長期的なトレンド移動の場合、画面に多くのSECONDARY矢印が表示されます(添付の
Introduction to Fractal Pattern Scanner Fractal Indicator refers to the technical indicator that makes use of the fractal geometry found in the financial market. Fractal Pattern Scanner is the advanced Fractal Indicator that brings the latest trading technology after the extensive research and development work in the fractal geometry in the financial market. The most important feature in Fractal Pattern Scanner is the ability to measure the turning point probability as well as the trend probabi
通貨強さウィザードは、取引を成功させるためのオールインワン ソリューションを提供する非常に強力な指標です。このインジケーターは、複数の時間枠のすべての通貨のデータを使用して、このまたはその外国為替ペアのパワーを計算します。このデータは、使いやすい通貨インデックスと通貨パワーラインの形式で表され、特定の通貨のパワーを確認するために使用できます。 必要なのは、取引したいチャートにインジケーターを接続することだけです。インジケーターは、取引する通貨の実際の強さを示します。このインジケーターは、トレンドに合わせて取引するときに有利に利用できる売買高の圧力の極値も示します。このインジケーターには、フィボナッチに基づく可能なターゲットも表示されます。 このインジケーターは、PUSH 通知を含むあらゆるタイプのアラートを提供します。 購入後ご連絡下さい。私の取引のヒントをあなたと共有し、素晴らしいボーナスインジケーターを無料で提供します! 幸せで有益な取引をお祈りします。
現在40%オフ 初心者やエキスパートトレーダーに最適なソリューション! このインジケーターは、独自の機能と新しい計算式を取り入れた、ユニークで高品質、かつ手頃な価格のトレーディングツールです。たった1枚のチャートで28の為替ペアの通貨強度を読み取ることができます。新しいトレンドやスキャルピングチャンスの引き金となるポイントを正確に特定することができるので、あなたのトレードがどのように改善されるか想像してみてください。 ユーザーマニュアルはこちら  https://www.mql5.com/en/blogs/post/697384 これが最初の1本、オリジナルだ! 価値のないクローンを買わないでください。 特別な サブウィンドウの矢印で強い通貨の勢いを表示 GAPがあなたのトレードを導く! 基準通貨や気配値が売られすぎ・買われすぎのゾーン(外相フィボナッチレベル)にあるとき、個別チャートのメインウィンドウに警告表示。 通貨がレンジの外側から反落した場合、プルバック/リバーサルのアラート。 クロスパターンの特別なアラート 複数の時間枠を選択可能で、トレンドを素早く確認できます
Cycle Sniper
Elmira Memish
4.39 (36)
Please contact us after your purchase and we will send you the complimentary indicators to complete the system Cycle Sniper is not a holy grail but when you use it in a system which is explained in the videos, you will feel the difference. If you are not willing to focus on the charts designed with Cycle Sniper and other free tools we provide, we recommend not buying this indicator. We recommend watching the videos about the indiactor and system before purchasing. Videos, settings  and descri
Market Structure Patterns   is an indicator based on   smart money concepts   that displays   SMC/ICT   elements that can take your trading decisions to the next level. Take advantage of the   alerts ,   push notifications   and   email messages   to keep informed from when an element is formed on the chart, the price crosses a level and/or enters in a box/zone. Developers can access the values of the elements of the indicator using the   global variables  what allows the automation of trading d
購入後、このインジケーターに基づいたボーナスEAを受け取るためにご連絡ください。 Self Optimizing Double MA Strategyは、パラメータ推測の必要性を排除するために設計されたプロフェッショナルグレードの取引ツールです。組み込みの自動最適化エンジンを搭載し、バックグラウンドで何千ものパラメータの組み合わせをシミュレートすることで、変化する市場状況に継続的に適応し、統計的な優位性を維持します。 静的で時代遅れの設定に依存するのではなく、インジケーターは自身のロジックを動的に更新し、現在の時間枠と取引商品にとって最も収益性の高い構成を見つけ出します。 主な機能 組み込みの自動最適化: 選択した更新頻度に基づいて、システムはFast MA、Slow MA、およびRSIの期間を定期的に再計算し、設定が常に現在の市場のリズムと一致するようにします。 MAダイバージェンスフィルター: 移動平均線が明確に乖離している(広がっている)場合にのみシグナルを検証する、トレンド強度のコア指標です。これにより、移動平均線が収束している相場や平坦なレンジ相場での誤ったエントリーを防ぎ
デイトレーダーマスターは、デイトレーダーのための完全なトレーディングシステムです。システムは2つのインジケーターで構成されています。 1つの指標は売買する矢印信号です。それはあなたが得る矢印インジケーターです。 2つ目のインジケーターを無料で提供します。 2番目のインジケーターは、これらの矢印と組み合わせて使用​​するために特別に設計されたトレンドインジケーターです。 インジケーターは繰り返さず、遅れないでください! このシステムの使用は非常に簡単です。 2色の線で表示されている現在のトレンドの方向に矢印信号をたどる必要があります。青は買いの傾向です。赤い色は売りの傾向です。青い矢印は買いシグナルです。赤い矢印は売りの合図です。トレンドラインの色と一致するように、矢印の色と信号の方向が必要です。 矢印インジケーターは、主に時間間隔M5とM15での日中取引のために作成されました。ただし、技術的には、システムは他の時間間隔で使用できます。 インジケータには、PUSHメッセージ機能を備えたポップアップアラートが装備されています。 購入後、必ず私に書いてください!私はあなたにシステムとの取引の
Candle Power Pro
Thushara Dissanayake
4.5 (8)
その   キャンドルパワープロ   は、解読するために設計された洗練された取引ツールです。     実ボリューム圧力、ティックデータの不均衡、機関投資家の注文フローのダイナミクス   測定することにより   強気相場と弱気相場の戦い   リアルタイムでこの指標は生の   ボリュームデータを実用的な洞察に 変換し、トレーダーが   スマートマネーの動き、流動性ハンティング、そして隠れた市場心理   各価格ローソク足の裏にあるものを分析することで   買い手/売り手の取引量の割合、乖離パターン、取引量に基づく確認など 、     価格行動とボリューム分析は 、トレーダーにとって非常に貴重です。       ICT、SMC、および機関投資家向け取引手法 。 従来のボリュームインジケーターとは異なり、     キャンドルパワープロ   焦点を当てる   ティックデータの粒度は 、各ローソク足の動きが基礎となる   強気/弱気の強さ   または潜在的な   マーケットメーカーの罠、反転、またはブレイクアウトの継続を 予測します。     セッションベースの戦略(ロンドン/ニューヨークのキルゾー
もしあなたがFX取引をしているなら、通貨の強さと通貨ペアの相関関係に関する詳細な情報を持つことは、取引パフォーマンスを飛躍的に向上させることができます。相関関係を活用すればリスクを半減でき、強さの分析を活用すれば利益を最大化することが可能です。 このインジケーターは、通貨の強さ分析と通貨ペアの相関関係を組み合わせたハイブリッドなアプローチにより、最適な通貨ペアを選択するサポートをします。 通貨の強さ分析の使い方 例えば、あなたの取引戦略でAUD/JPYの買いシグナルが出たとします。しかしKTの通貨強さ分析を使うと、JPYがAUDよりも強くなっていることがわかりました。この場合、その取引は損失に終わる可能性が高いです。このインジケーターがあれば、そのような損失を未然に防ぐことができます。 通貨ペア相関関係の使い方 例えば、NZD/USDとGBP/JPYの同時売りシグナルが出たとします。KTの通貨ペア相関ツールを使うと、これらのペアの相関率が77%であることが判明します。  これらのペアは強く相関しているため、同時に取引するとリスクが二重になります。もしNZD/USDで損失が出れば、
CRT Candle Range Theory HTF MT4.   Ultimate CRT Indicator: Advanced ICT Concepts and Malaysian SnR Trading System Discounted   Price   $50  !!     Secure your lifetime access   now   before it switches to   subscription-only ! Master the Market Maker's Footprints with the Most Advanced Candle Range Theory Indicator Unlock the true power of   Smart Money Concepts (SMC)   and trade precisely like the institutions with the   Ultimate CRT Indicator . Built exclusively for serious traders, this indic
Route Lines Prices -は、価格の方向性を予測するために設計されたインジケーターです。シンプルなインターフェースには、価格変動と将来の方向性を計算するための複数のアルゴリズムが搭載されています。これらのアルゴリズムには、使用する時間枠に基づいたボラティリティ計算と価格平滑化が含まれています。 このインジケーターには、「 Calculating price values 」値を変更するためのパラメーターが1つだけあります。デフォルト値の1は、バランスの取れた自動計算を提供し、インジケーターを手動で設定することなく使用できます。 値を2から500まで手動で変更することで、インジケーターを独自のトレーディングシステムに合わせてカスタマイズできます。 このインジケーターは、M1からH4の時間枠での使用を推奨します。あらゆる取引銘柄で使用できます。 シグナル矢印はローソク足の終値で生成され、過去の履歴には再描画されません。 メインチャートには、重複した矢印が表示されます。 複数のアラートタイプが利用可能です。内蔵のライン軌跡カウンターは、終値に基づいて動作します。これ
頭と肩のパターンは、3つのピークを持つベースラインに似たチャート構成であり、外側の2つは高さが近く、中央は最高です。強気から弱気のトレンド反転を予測し、最も信頼性の高いトレンド反転パターンの1つと考えられています。これは、トレンドが終わりに近づいていることをさまざまな精度で知らせるいくつかのトップパターンの1つです。 [ インストールガイド | 更新ガイド | トラブルシューティング | よくある質問 | すべての製品 ] クリアな取引シグナル カスタマイズ可能な色とサイズ パフォーマンス統計を実装します カスタマイズ可能なフィボナッチリトレースメントレベル 適切なストップロスおよび利益レベルを表示します インジケーターを使用して、継続パターンまたは反転パターンを見つけることができます 再描画および非再描画ではありません 電子メール/音声/視覚アラートを実装します 設定 チャートにインジケーターをロードすると、入力パラメーターとして一連のオプションが表示されます。パラメーターが自明のブロックにグループ化されているため、それらが多すぎると思う場合でも、絶望しないでください。これは、パ
CRYSTAL HEIKIN ASHI SIGNALS MT4 Professional Trend Detection Indicator with Smart Entry Signals See the Trend. Catch the Move. Trade with Confidence. The professional Heikin Ashi indicator built for traders who want clarity, precision, and EA-ready signal automation. WHAT IS CRYSTAL HEIKIN ASHI SIGNALS? Crystal Heikin Ashi Signals is a professional-grade MetaTrader 4 indicator that combines pure Heikin Ashi candle visualization with an advanced momentum-shift detection system. Designed for both
作者のその他のプロダクト
True Momentum LPD
Safwan Rushdi Khalil Arekat
MT5 Version : Pre Note : The indicator uses the Open price value for calculations. This indicator represents a genuine momentum oscillator according to the true definition of "Momentum", and as realised by the techniques of digital filters. Scholarly papers   on the subject   by the current developer can be found   here  and here , but in this description we shall borrow only the minimum of conceptual and mathematical framework needed. In the process, we expose some long-held myths about indica
FREE
True Momentum
Safwan Rushdi Khalil Arekat
5 (7)
This indicator represents a genuine momentum oscillator according to the true definition of "Momentum", and as realised by the techniques of digital filtering. ( Note : download a complete set of true momentum oscillators  here ). A scholarly paper on the subject   by the current developer can be found here , but in this description we shall borrow only the minimum of conceptual and mathematical framework needed. In the process, we expose some long-held myths about indicators supposedly measurin
FREE
Latest Changes in 1.6 :  Added Signal Modes input. Mode 1 : HPF positive go long blue, HPF negative go short red. Mode 2 : slow envelope only, HPF above upper envelope go long blue, HPF below lower envelope go short red. Mode 3 : HPF above both upper envelopes - go long blue, HPF below both lower envelopes go short red. Mode 4 : Go long blue if HPF crosses above upper slow, but fast upper should be below slow upper at the time, exit when HPF crosses below upper fast, reverse logic for short red
FREE
This indicator is a useful tool for visualising cyclic components in price. It calculates the Discrete Fourier Transform (DFT) of a price chart data segment selected by the user. It displays the cycles, the spectrum and the synthesised signal in a separate window.  The indicator is intended as a learning tool only, being unsuitable for providing actual trade signals. Download the file -  it is a free toy. Play with it to understand how signals can be transformed by controlling their cyclic comp
FREE
This indicator applies the  biquad high pass filter to the price-chart data, and displays the filter output for the OHLC as candlesticks. The candlesticks corresponds to the actual calculations of the filter value  during the formation of each price bar (not from all historical highs lows or closes). The shape of the bars therefore corresponds directly to the shape of each price bar. High pass filters are an underappreciated type of oscillator that are seldom used in technical analysis in the st
FREE
This indicator does not process the price chart data and does not provide trading signals. Instead, it is  an application to compute and display the frequency response of many conventional indicators. Moving averages like the SMA, LWMA and EMA, and  oscillators like the MACD, CCI, Awsome Osc, all have the form of digital filters. Electronic engineers use a special method to characterise the performance of these filters by studying their frequency response. Two important quantities of the freque
FREE
Jerk Indicator
Safwan Rushdi Khalil Arekat
5 (1)
In physics, "Jerk" is the third time-derivative of position, with acceleration being the second derivative and velocity the first derivative. In technical analysis, the first derivative of price is the price momentum, with the second derivative,acceleration, being seldom used and the third derivative virtually unknown. The magnitude frequency response of a digital differentiator is a positive-slope straight line passing through zero frequency. Therefore, every instance of a digital signal differ
FREE
This indicator resolves an unrecognised defect in the Commodity Channel Index Oscillator (CCI). The CCI is based on a high pass filter calculated by subtracting the p-period simple moving average of a price signal (usually typical value) from the price signal itself. Then, the result is divided by the absolute mean deviation of the same period. The frequency response of a signal minus its simple moving average is shown in the first screen shot (in Blue). (see my free indicator : Q n D Frequency
FREE
This indicator demonstrates that the price change of financial instruments is NOT a random walk process, as advocated by the "Random Walk Hypothesis", and as popularised by the bestselling book "A Random Walk Down Wall Street". I wish that were the case!  It is shown here that the real situation with price change is actually much worse than a random walk process!  Deceptive market psychology, and the bulls-bears tug of war, stack up the odds against traders in all instruments, and all time frame
FREE
This indicator provides trading signals based on the polarity of the dynamical parameters of two digital signals. The dynamical parameters (momentum-acceleration) are derived by applying a high quality momentum oscillator, MTEMA LPD ( see Top Gun Oscillators ) to two digital signals. The MTEMA momentum oscillator is first applied to the price itself. Then, a rectification procedure is applied to the price based on the signals from the momentum oscillator yielding a rectified price signal. This s
FREE
Volatility Limit Trend Indicator (VLT), an original indicator by this developer,  is a trend indicator based on setting a fixed volatility limit as a percentage of price. Volatile price is allowed to wander between two channel lines defining the fixed volatility about a central line. The price crossing one of the channel lines defines an exceeding of the allowed volatility, and ushering in one of two situation : either a continuation or a reversal of trend. The first buffer of the indicator (not
FREE
MUST READ CAUTION BEFORE PURCHASE This  one-of-a-kind indicator displays the instantaneous high resolution High Time Frame Relative Strength Index  (HTF RSI), where  up to three higher time-frame RSI's can be displayed simultaneously on the current chart. The indicator differs drastically from previous multi-time-frame RSI indicators in that it displays  the high resolution bar-by-bar calculation of the HTF RSI - and not just the discrete values at the HTF bar closings. This allows for earlier
フィルタ:
Artialberta
730
Artialberta 2025.04.03 15:55 
 

Intéressant.

Thomas Maehrel
733
Thomas Maehrel 2023.10.01 17:04 
 

ユーザーは評価に対して何もコメントを残しませんでした

Safwan Rushdi Khalil Arekat
7242
開発者からの返信 Safwan Rushdi Khalil Arekat 2023.10.03 15:00
Thanks Thomas. Good Luck.
AlbertZAR
670
AlbertZAR 2023.05.02 20:48 
 

ユーザーは評価に対して何もコメントを残しませんでした

Safwan Rushdi Khalil Arekat
7242
開発者からの返信 Safwan Rushdi Khalil Arekat 2023.05.04 02:54
Dear AlbertZAR, I am truly humbled by your kind words. I learned from so many generous professionals. Its time for me to share a little. Thank you
lisi 7887
1724
lisi 7887 2023.02.17 16:05 
 

Thank you! You are the best!!!

Safwan Rushdi Khalil Arekat
7242
開発者からの返信 Safwan Rushdi Khalil Arekat 2023.02.17 16:33
Thanks lisi for the rating, and for your kind words. Good Luck !
レビューに返信