Trend deviation scalper MT4
- Indikatoren
- Version: 1.20
- Aktualisiert: 22 September 2022
- Aktivierungen: 5

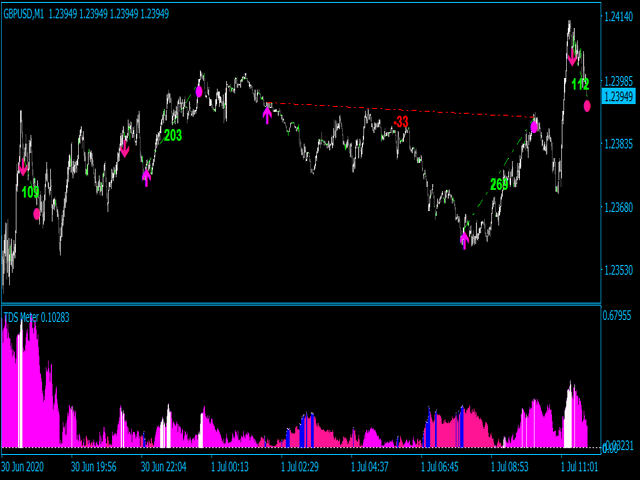
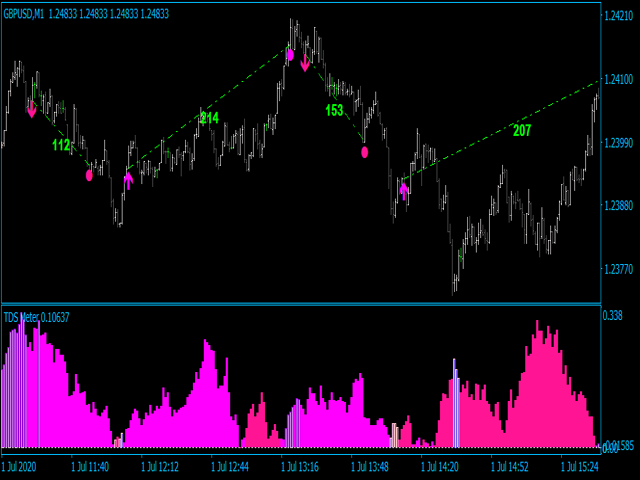
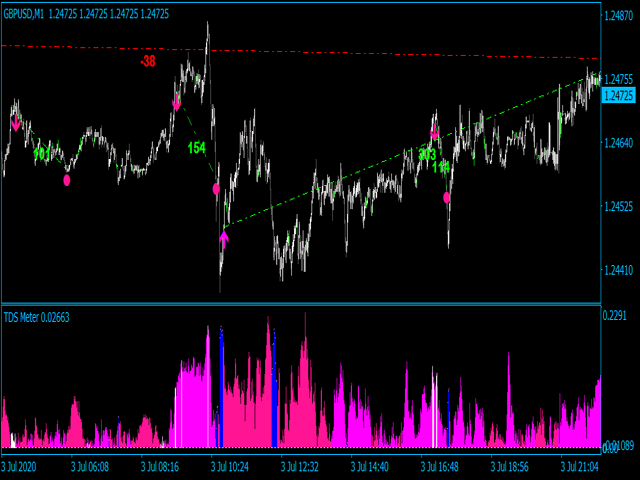
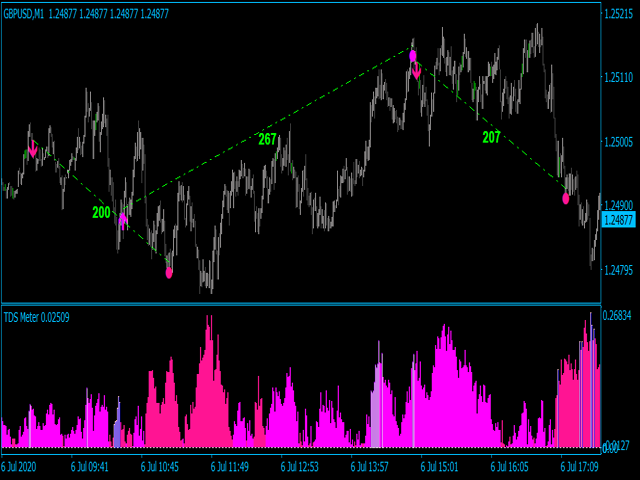
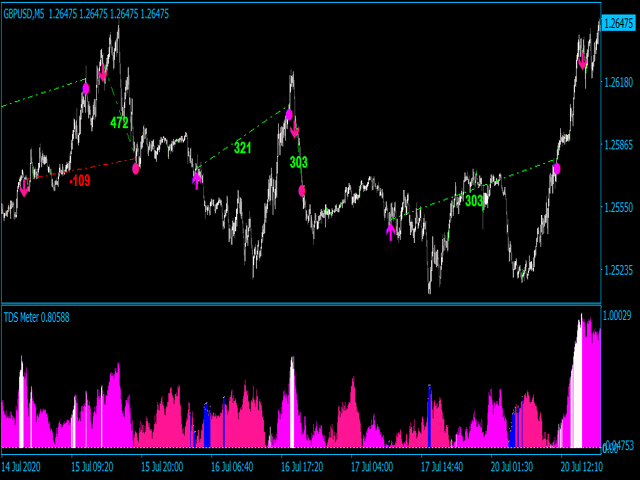
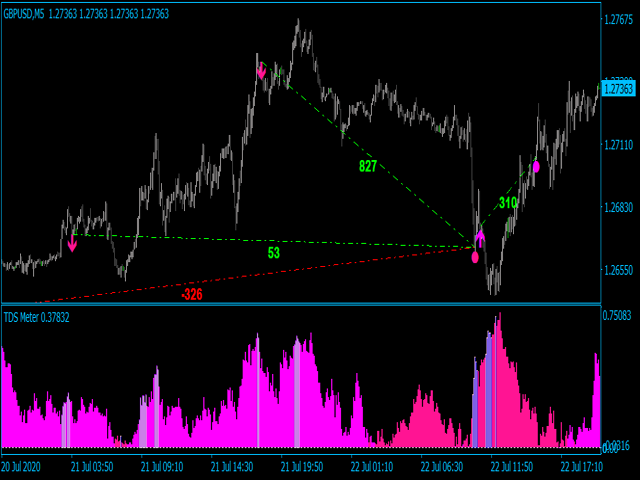
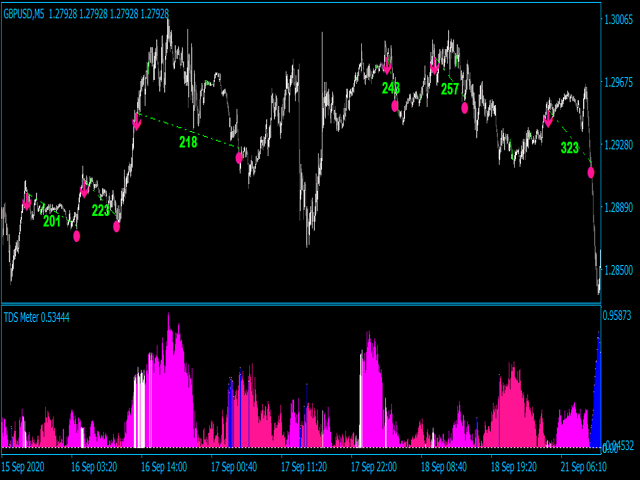
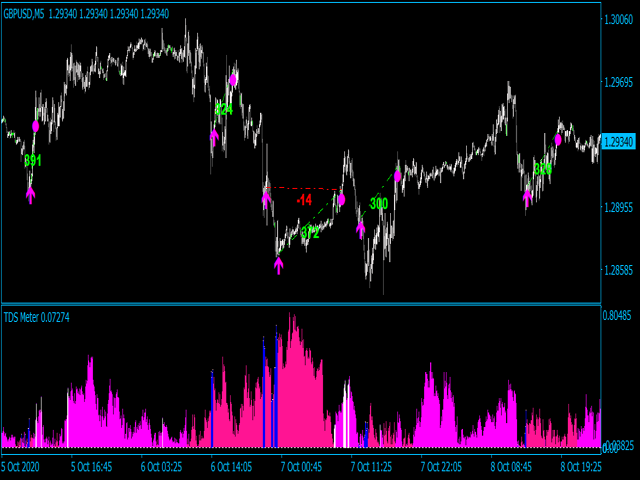
Trendabweichung Scalper - ist das manuelle System zum Scalping von unruhigen Märkten. Der Indikator definiert den Bullen-/Bärentrend und seine Stärke. Innerhalb des exakten Trends definiert das System auch "schwache" Stellen, wenn der Trend bereit ist, sich umzukehren. In der Regel zeichnet das System einen Verkaufspfeil, wenn der Aufwärtstrend schwach wird und möglicherweise in einen Abwärtstrend umschlägt. Für den Kaufpfeil gilt das Gegenteil: Der Pfeil wird bei einem schwachen Bärentrend eingezeichnet. Eine solche Anordnung ermöglicht es Ihnen, einen günstigen Preis zu erhalten und Marktgeräusche zu überstehen. Verlustpfeile werden durch gemeinsamen Gewinn geschlossen. Lot-Erhöhung nie verwendet. Jeder Pfeil stellt die anfängliche Losgröße dar.
Hauptmerkmale des Indikators
- Signale werden nicht wiederholt, nicht verspätet oder verschwinden (außer wenn das System alle historischen Daten neu berechnet, die Haupteinstellungen aktualisiert oder Metatrader neue Daten einspielt);
- Jedes Signal kommt bei der Eröffnung eines neuen Balkens (das System verwendet nur bestätigte Signale);
- Der Indikator verfügt über Alerts, Mail- und Push-Benachrichtigungen (erlaubt den Handel vom PC aus, vom Smartphone/von der Handy-App);
- Das System ist 100% autoadaptiv und muss nicht manuell angepasst werden. Einfach einrichten und mit dem Handel beginnen.
- Es ist möglich, die Pfeilstrategie zu deaktivieren und nur das Histogramm zu verwenden.
Empfehlungen für den Handel
- Scalping Zeiträume: M1-M15 Bereich;
- Volatilitätspaare wie EURUSD, GBPUSD, USDCAD, GOLD, Krypto;