Trend driver bars Iindicator MT4
- Indikatoren
- Version: 1.30
- Aktualisiert: 22 September 2022
- Aktivierungen: 5

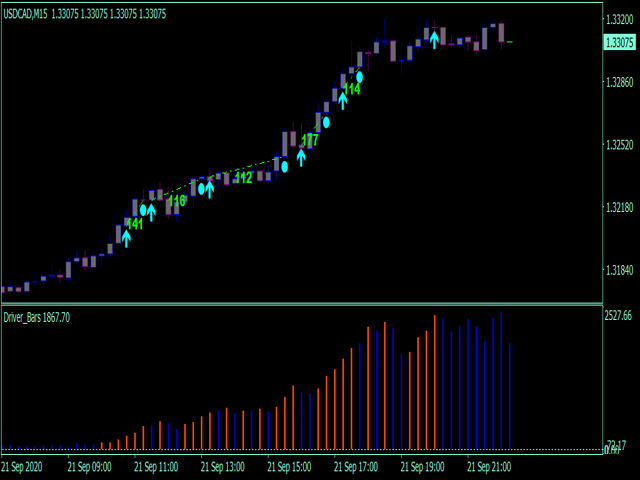
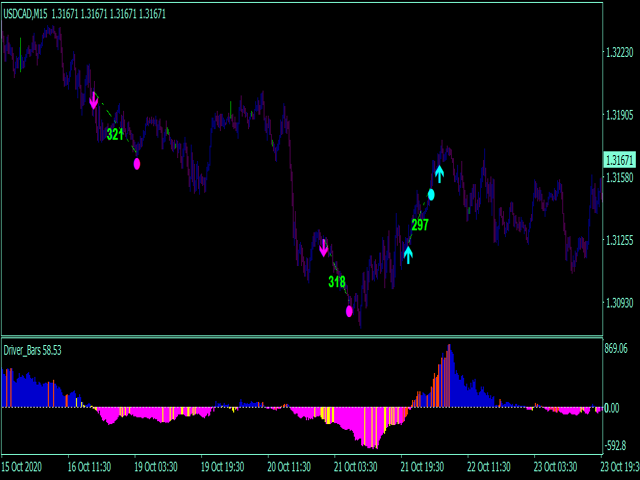
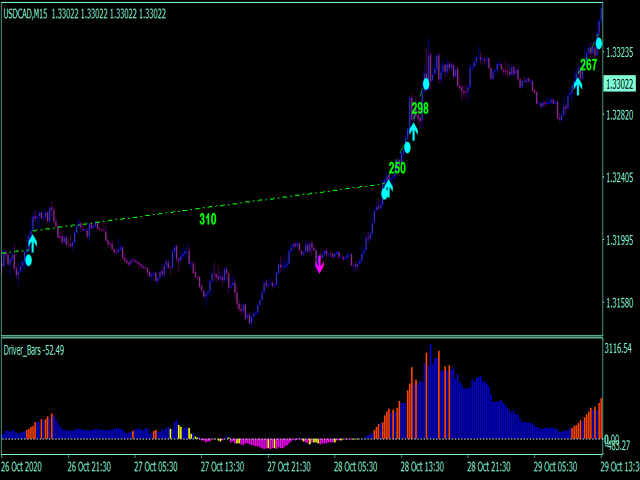
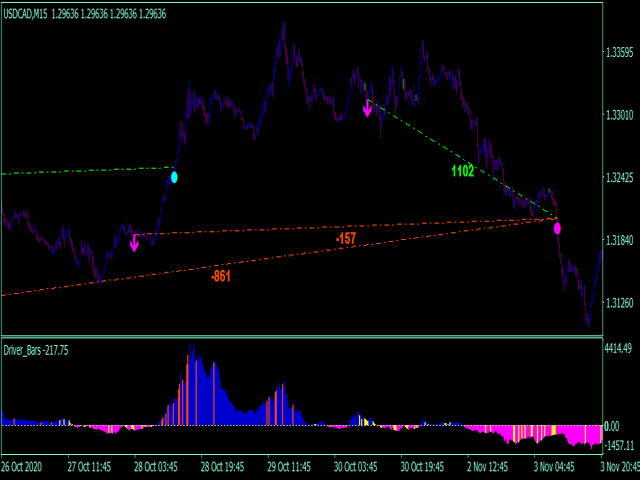
Trend-Treiber-Balken sind ein manuelles Handelssystem, das die Fortsetzung des aktuellen Trends oder seinen Rückzug/Umkehr definiert. "Treiber"-Balken - sind Preisaktionsmuster, die einen starken Einfluss auf den Markt haben und seine zukünftige Richtung bestimmen. Im Allgemeinen stellen die Treiber-Balken das "Skelett" des Trends dar und nehmen oft neue Marktimpulse vorweg. Das System zeichnet Pfeile, wenn der Markt 3 Muster in einer Reihe zeigt (das mächtigste Kombinationsmuster), und ermöglicht ein schnelles Scalping der ankommenden Bewegung. Verlustpositionen werden durch gemeinsame Gewinne geschlossen. Lot-Erhöhung nie verwendet. Das System sichert Positionen ab, um Risiken zu minimieren.
Hauptmerkmale des Indikators
- Signale werden nicht nachgemalt, nicht verspätet oder verschwinden (außer in Fällen, in denen das System alle historischen Daten neu berechnet, die Haupteinstellungen aktualisiert oder Metatrader neue eingehende Daten auffrischt);
- Jedes Signal kommt bei der Eröffnung eines neuen Balkens (das System verwendet nur bestätigte Signale);
- Der Indikator verfügt über Alerts, Mail- und Push-Benachrichtigungen (erlaubt den Handel vom PC aus, vom Smartphone/von der Handy-App);
- Das System ist 100% autoadaptiv und muss nicht manuell angepasst werden. Einfach einrichten und mit dem Handel beginnen.
- Es ist möglich, die Pfeilstrategie zu deaktivieren und nur das Histogramm zu verwenden.
Empfehlungen für den Handel
- Scalping timefrsmes: M5-H1 Bereich;
- Volatilitätspaare wie EURGBP, GBPJPY, USDJPY, GOLD, Krypto;