Trend deviation scalper MT4
- Indicadores
- Versión: 1.20
- Actualizado: 22 septiembre 2022
- Activaciones: 5

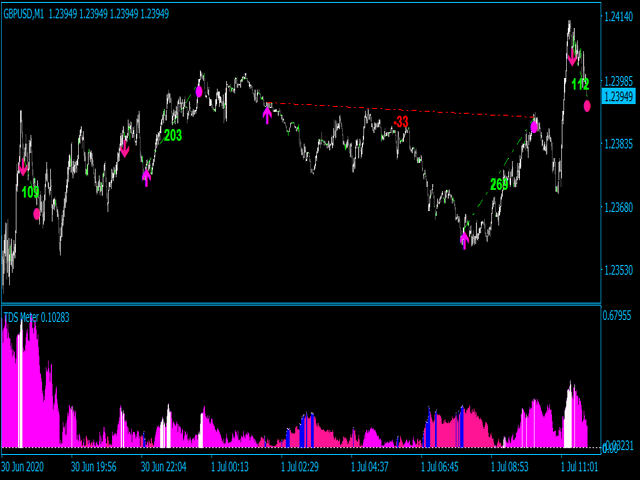
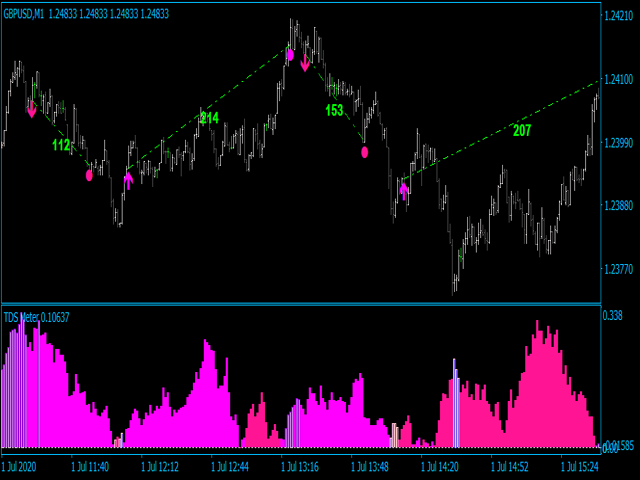
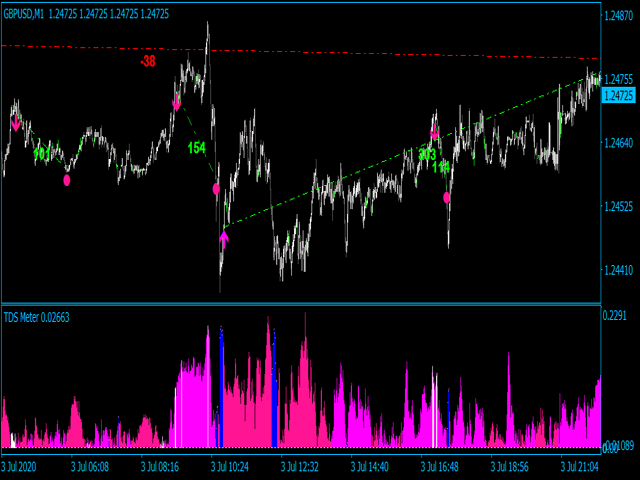
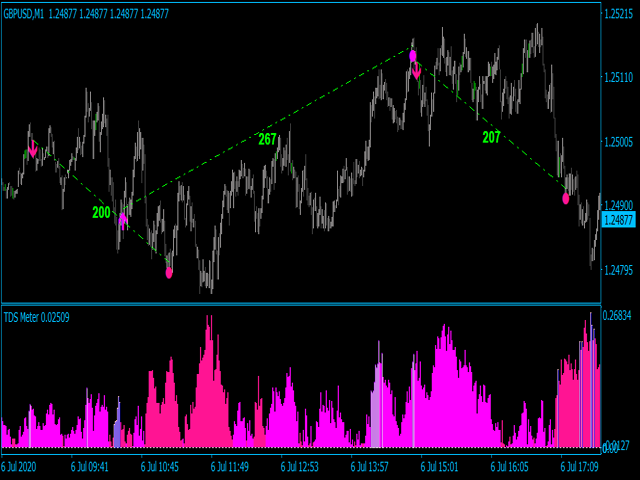
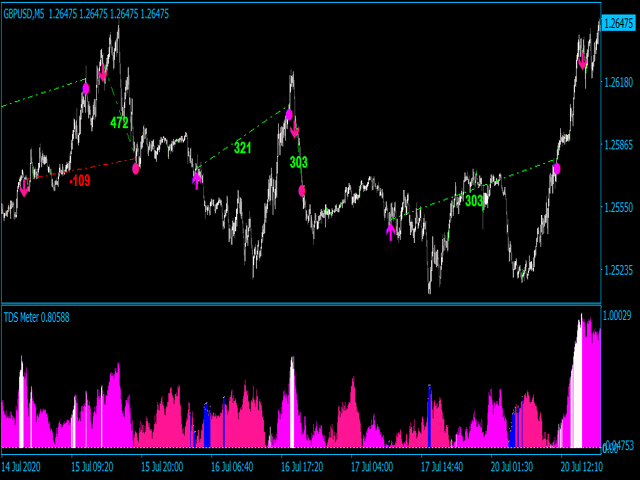
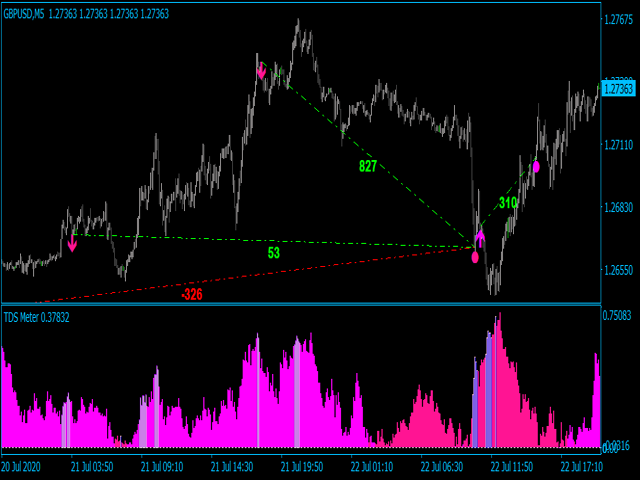
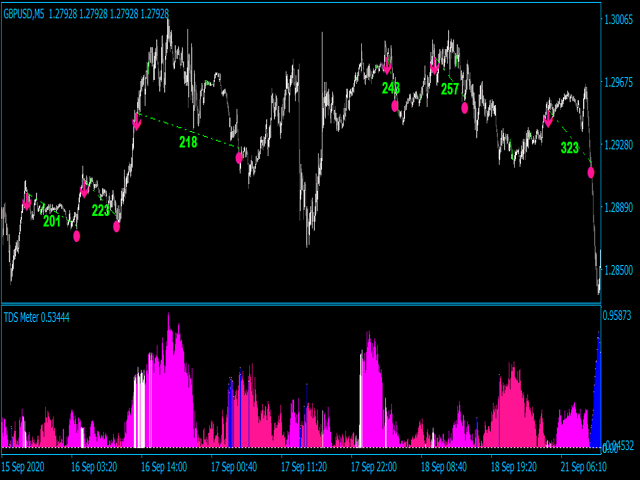
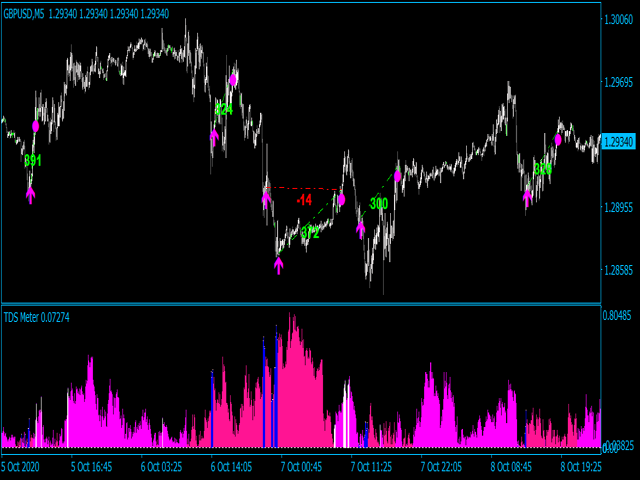
Desviación de la tendencia scalper - es el sistema manual para arrancar el cuero cabelludo choppy lugares de mercado. Indicador define la tendencia alcista / bajista y su fuerza. Dentro de la tendencia exacta, el sistema también define los lugares "débiles", cuando la tendencia está lista para invertirse. Así que por regla general, el sistema traza una flecha de venta cuando la tendencia alcista se debilita y posiblemente se invierte a la tendencia bajista. Para la flecha de compra es lo contrario: la flecha se traza en la débil tendencia bajista. Esta disposición le permite obtener un precio favorable y hacer frente al ruido del mercado. Las flechas de pérdida se cierran por el beneficio común. El aumento del lote nunca se utiliza. Cada flecha representa el tamaño inicial del lote.
Características principales del indicador
- Las señales no se repintan, no se retrasan o desaparecen (excepto en los casos en que el sistema recalcula todos los datos históricos, actualiza la configuración principal o Metatrader actualiza los nuevos datos entrantes);
- Cada señal viene en la apertura de la nueva barra (el sistema utiliza sólo las señales confirmadas);
- Indicador tiene alertas, correo y notificaciones Push(permitir el comercio fuera de la PC, desde el teléfono inteligente / aplicación móvil);
- El sistema es 100% autoadaptive sin necesidad de ajuste manual. Sólo tiene que configurar y empezar a operar.
- Posibilidad de desactivar la estrategia de flecha y utilizar sólo histograma.
Recomendaciones para el comercio
- Scalping timefrsmes: Rango M1-M15;
- Pares de volatilidad como EURUSD, GBPUSD, USDCAD, GOLD, Crypto;