TPM cross indicator MT4
- Indikatoren
- Version: 1.0
- Aktivierungen: 5

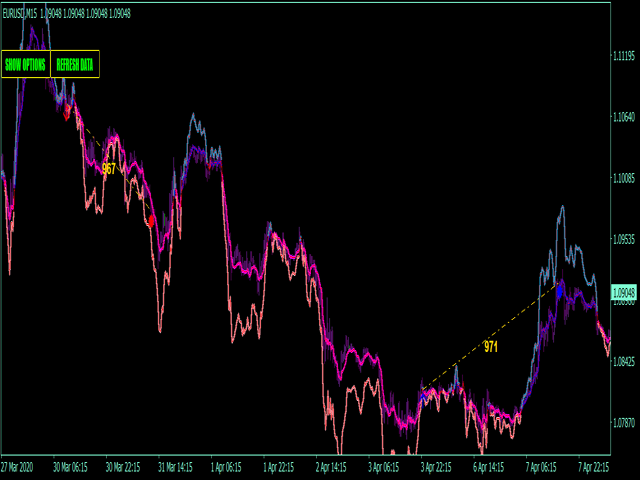
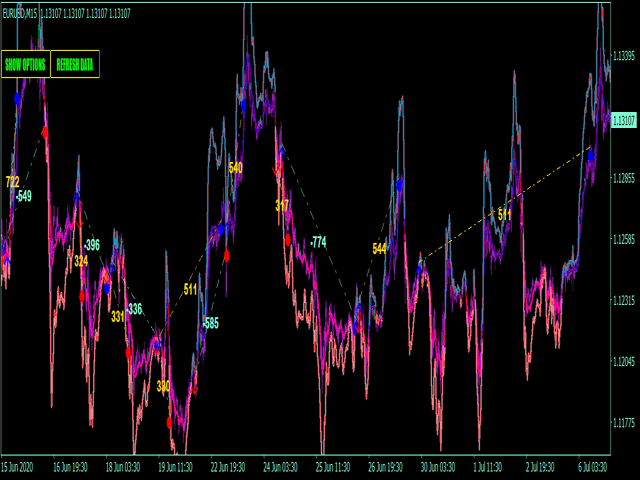
TPM Cross (trend power moving cross) - ist eine Trendfolgestrategie, die auf benutzerdefinierten Signalpunkten basiert.
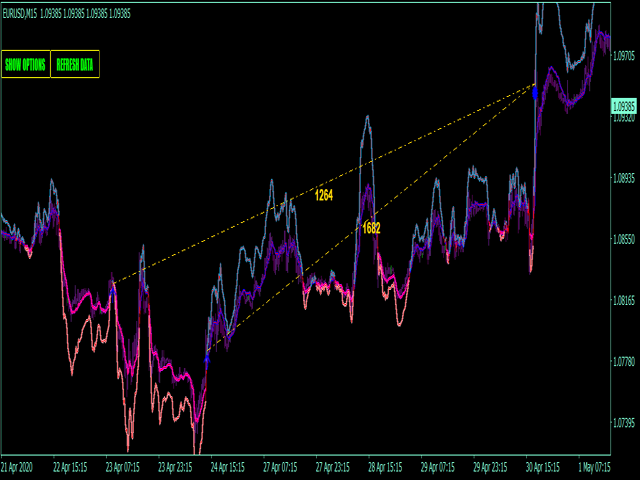
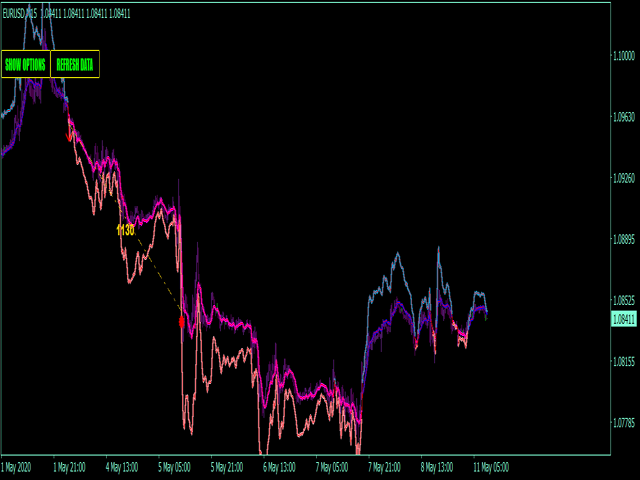
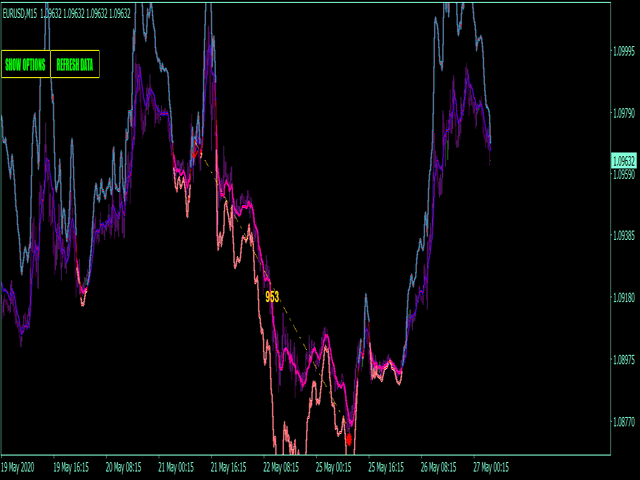
Der Indikator besteht aus einer beweglichen Hauptdiagrammlinie und einer Trend-Power-Linie. Der Indikator definiert Auf- und Abwärtsbewegungen durch seine Trendstärke und die benutzerdefinierte Bewegungsrichtung. Wenn der aktuelle Markttrend seine Kraft verliert und ein gegenläufiger Trend einsetzt, kreuzt die Power-Trendlinie
kreuzt die Bewegung und der Indikator zeichnet einen Pfeil.
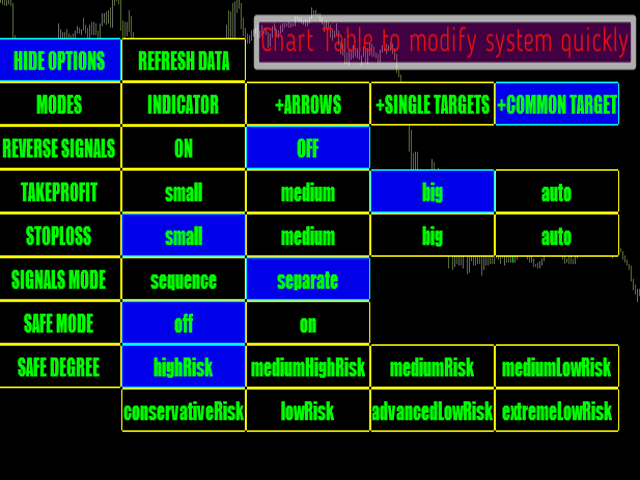
Die einstellbaren Eingaben des Hauptindikators :
- movingPeriod - Periode der gleitenden Linie
- trendPeriod - Periode der Trendlinie (in der Regel größer als movingPeriod)
Eigenschaften des Hauptindikators
- Die Signale werden nicht nachgemalt, verspätet oder verschwinden;
- Jedes Signal kommt bei der Eröffnung eines neuen Balkens (das System verwendet nur bestätigte Signale);
- Der Indikator verfügt über Alerts, Mail- und Push-Benachrichtigungen (ermöglicht den Handel vom PC aus, vom Smartphone/von der Handy-App);
- Der Indikator hat Gewinn/Verlust-Ziele;
Empfehlungen für den Handel
- Volatilität beliebte Märkte mit niedrigem Spread;
- Beste Zeitrahmen - Intraday-Zeitrahmen bis zum H1-H4-Zeitrahmen;