TickChart Indicator Lite for MT5
- Indikatoren
-
Mika Akimoto
 Developing tools for MT4 and MT5.
 - Version: 1.1
Der TickChart-Indikator zeichnet Tick-Linien im Hauptfenster des MetaTrader.
In der Lite-Version ist die Anzahl der Ticks auf 20 begrenzt und die unten beschriebene Warnfunktion entfällt.
Die Tick-Linie zeigt die detailliertesten, schnellsten und Echtzeit-Aktivitäten des Marktes an, die normalerweise in Balken oder Kerzen, die länger als 1 Minute sind, verborgen sind. Normalerweise erscheinen mehrere neue Tickline-Segmente, während ein Balken des Zeitrahmens M1 abgeschlossen wird. Nach der Veröffentlichung eines wichtigen Wirtschaftsindikators kann die Anzahl der Ticks pro Balken 100 übersteigen.
Dieser Indikator überlagert die Tick-Linie mit normalen Zeichen im Hauptfenster. Während normale Charts im "Zeit-Preis"-Raum sind, ist das Tick-Chart im "Tick-Preis"-Raum, d.h. die X-Achse des Tick-Charts ist nicht die Zeit. Wenn der Markt sehr aktiv ist, schreitet die X-Achse des Tick-Charts schnell voran und umgekehrt.
Der TickChart-Indikator ist in vielen Situationen nützlich. Zum Beispiel,
- Ein Werkzeug für Scalping: Sie können mehrere Chancen in einer Minute finden
- Finden Sie Chancen in den Turbulenzen nach der Veröffentlichung von wichtigen Wirtschaftsindikatoren: Der Tickchart zeigt die detaillierten Kursveränderungen, die in einer langen Bullen-/Bärenkerze verborgen sind
- Wie ein Elektrokardiogramm des Marktes: Das Tempo der Erzeugung von Tick-Chart-Segmenten zeigt an, wie vital der Markt ist
- Marktbeobachtung in mehreren Zeitrahmen: Sie können zum Beispiel den Tick-Chart und den M15-Zeitrahmen-Chart im selben Fenster sehen. Dieser Indikator überlagert den kürzesten Zeitrahmen, den Tick.
- Warnung bei signifikanten Preisänderungen: Senden Sie eine E-Mail und/oder Benachrichtigungen mit Hilfe des RSI und der Hüllkurvenabweichung.
Es gibt vielleicht noch mehr Verwendungsmöglichkeiten. Wenn Sie eine schöne Anwendung finden, lassen Sie es mich bitte wissen.
Eingaben
| Name des Parameters | Beschreibung |
|---|---|
| Anzahl der zu zeichnenden Ticks | Sie beträgt etwa 200. Zu viele Ticks können den MetaTrader verlangsamen. |
| Tick-Bid-Linienbreite | Breite der Tick-Linie für den Geldkurs. Breite 0 bedeutet keine Tick-Bid-Linie |
| Farbe der Tick-Bid-Linie (MT5) | Farbe der Linie |
| Stil der Tick-Bid-Linie (MT5) | Linienstil, durchgezogen, gepunktet, ... |
| Tick-Ask-Linienbreite | Breite der Tick-Linie für den Briefkurs. Breite 0 bedeutet keine Tick-Ask-Linie |
| Farbe der Tick-Auftragslinie (MT5) | Farbe der Linie |
| Stil der Tick-Task-Linie (MT5) | Linienstil, durchgezogen, Punkte, ... |
| Tick-MA Zeitraum | Periode des SMA, d.h. wie viele Ticks werden für die Berechnung des gleitenden Durchschnitts verwendet |
| Tick-MA Bid-Linienbreite | Linienbreite des Tick-SMA auf dem Geldkurs. Breite 0 bedeutet keine SMA-Linie |
| Stil der Tick-MA-Gebotslinie (MT5) | Stil der Linie |
| Farbe der Tick-MA-Gebotslinie (MT5) | Farbe der Linie |
| Tick-MA-Brief-Linienbreite | Linienbreite des Tick-SMA auf dem Briefkurs. Breite 0 bedeutet keine SMA-Linie |
| Stil der Tick-MA-Brief-Linie (MT5) | Stil der Linie |
| Farbe der Tick-Ma Ask-Linie (MT5) | Farbe der Linie |
| E-Mail-Benachrichtigung | Schaltet den E-Mail-Alarm ein/aus. Der Alarm wird ausgelöst, wenn RSI und Envelope dasselbe Kauf-/Verkaufssignal wie unten beschrieben liefern.
Wenn "true", wird der Alarm gesendet , wenn ( (RSI<RSI_unteres_Level) oder (RSI>RSI_oberes_Level) ) und ( (Abweichung>Alarm_Level) oder (Abweichung< -Alarm_Level) ) |
| Alarmbenachrichtigung | Schaltet die Benachrichtigung ein/aus (mit der Option MetaQuotesID in MetaTrader). Derselbe Alarm wie oben. |
| Hüllkurvenzeitraum für Alert | Hüllkurvenzeitraum des Alarms. Der Zeitraum ist hier die Anzahl der Balken, nicht die Anzahl der Ticks. |
| RSI-Periode für Alarm | RSI-Periode des Alarms, die Anzahl der Balken. |
| RSI untere Alarmschwelle | Ein RSI, der unter diesem Wert liegt, zeigt an, dass sich der Kurs in der Nähe des Kaufbereichs befindet. |
| RSI oberer Alarmwert | RSI höher als dieser Wert zeigt an, dass sich der Preis in der Nähe des Verkaufsbereichs befindet |
| Hüllkurvenabweichung Alarmstufe | Hüllkurvenabweichung höher/niedriger als (Level)/(-Level) zeigt an, dass sich der Kurs in der Nähe des Kauf-/Verkaufsbereichs befindet |
| Mindestwarnintervall | In diesem Intervall wird kein Alarm nach dem vorherigen Alarm gesendet, um zu viele Alarme in einem Ereignis zu vermeiden. |
(MT5): Nur in der MetaTrader5-Version. In der MetaTrader4-Version befinden sich die Linieneigenschaften in der Eigenschaft des Indikators.
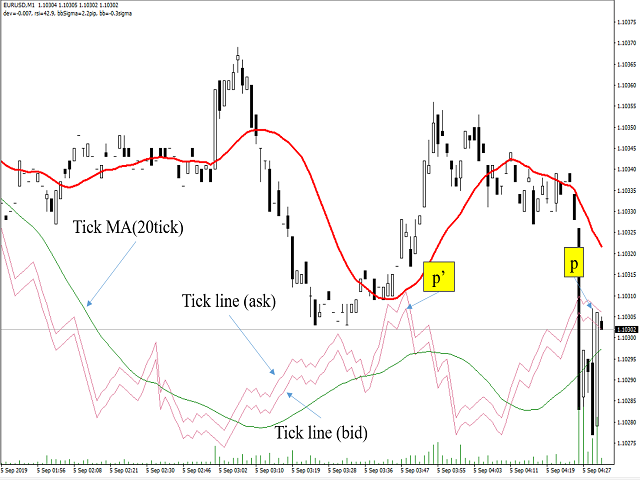
Bildschirmfoto
Der Screenshot zeigt die beiden Ticklinien der Geld- und Briefkurse und die 20MA-Ticklinie. Es zeigt, dass die detaillierten Preisänderungen innerhalb langer Kerzen stattfinden. Der Höchstpreis (p) einer Kerze wird als Spitze des Tick-Charts (p') angezeigt. Sie können viele Hochs und Tiefs innerhalb einer Kerze sehen und mehr Handelsmöglichkeiten finden.