YY Mono Waves MT5
- Indikatoren
- Version: 1.0
Der Indikator Mono Waves wurde entwickelt, um das Wellenverhalten des Marktes auf einem Chart darzustellen. Dieser Indikator verwendet den PPPC-Indikator (Point-Percent Price Channel), der kostenlos vom Market heruntergeladen werden kann.
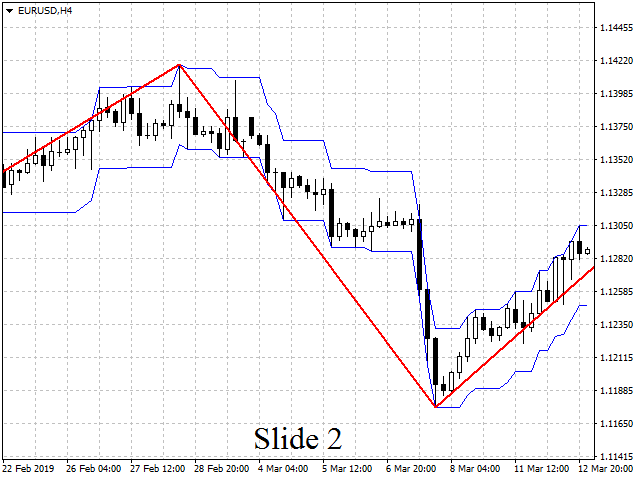
Wenn sich der Markt nach oben bewegt, wird die obere Grenze des Preiskanals auf den Höchstkursen der Kerzen gebildet (weitere Einzelheiten finden Sie in der Beschreibung des PPPC-Indikators unter dem oben angegebenen Link).Je höher die High-Kurse steigen, desto höher steigt der PPPC-Indikator-Kanal. In diesem Fall wird ein Segment der Mono-Waves-Indikator-Linie eingezeichnet, das nach oben gerichtet ist und zwei Punkte verbindet: den niedrigsten und den höchsten Punkt des Plots, auf dem der PPPC-Kanal ansteigt. Siehe Folie 2 (linke Seite).
Sobald der Preis die untere Grenze des Kanals berührt, geht der PPPC-Indikator dazu über, nun diese untere Grenze zu bilden, die beim Preis der Low-Kerzen gebildet wird. Und je tiefer die Low-Kurse fallen, desto tiefer fällt der Kanal des PPPC-Indikators. Gleichzeitig wird ein neues Segment der Linie des Mono-Waves-Indikators gezeichnet, das in die entgegengesetzte Richtung (nach unten) gerichtet ist und ebenfalls zwei Punkte miteinander verbindet: den höchsten und den niedrigsten Punkt des Plots, auf dem der PPPC-Kanal nach unten verläuft. Siehe Folie 2 (mittlerer Teil).
Wenn der Kurs die obere Begrenzung des Kanals berührt, schaltet der PPPC-Indikator wieder auf die Konstruktion dieser oberen Begrenzung um. Und der Mono Waves-Indikator konstruiert ein neues Segment seiner Linie, das wieder nach oben verläuft. Und so weiter ... Siehe Folie 2 (rechte Seite).
Da der Mono Waves-Indikator vollständig von der Funktionsweise des PPPC-Indikators abhängig ist, hat er genau dieselben Parameter wie dieser.
Parameter
- Kanalbreite in Punkten - Kanalbreite in Punkten;
- Kanalbreite in Prozenten - Kanalbreite in Prozent.
Für den Zweck dieser Parameter siehe die Beschreibung des PPPC-Indikators, zu dem der Link oben angegeben ist.
Spurlinien
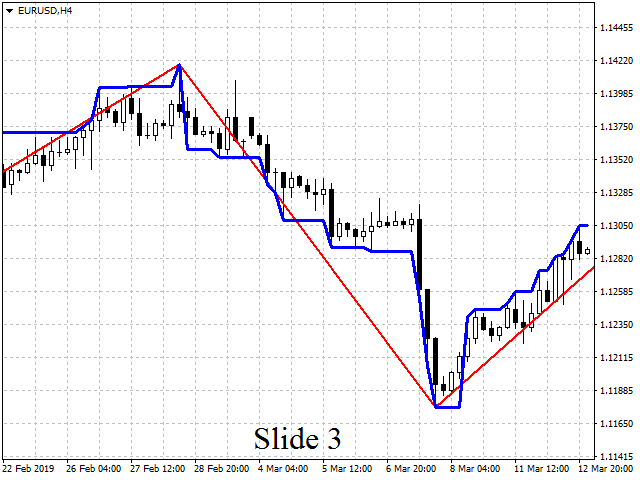
Neben der Haupt-Monowellenlinie hat dieser Indikator auch Spurlinien. Beim ersten Start des Indikators sind sie nicht sichtbar. Sie können jedoch eingeschaltet (visualisiert) werden, indem man für sie eine andere Farbe als transparent angibt, zum Beispiel blau. Wenn sie eingeschaltet sind, sieht der Indikator wie in Folie 3 dargestellt aus.
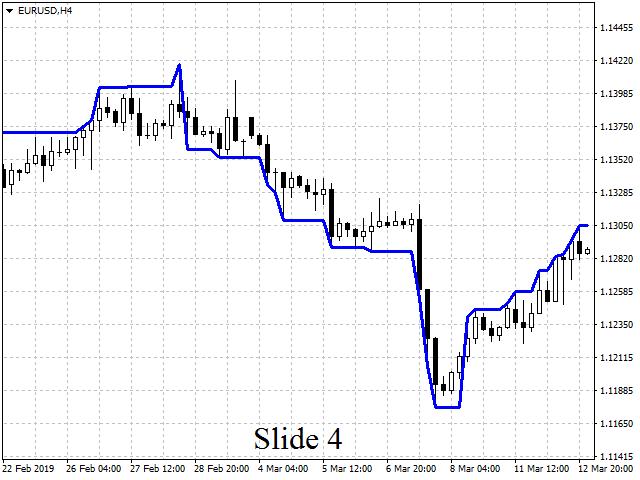
Warum werden diese Linien benötigt? Es gibt mindestens drei Gründe, warum sie im Chart zu sehen sind:Erstens zeigen diese Linien die Flugbahn an, entlang derer sich das rechte Ende des Monowellen-Liniensegments während seiner Entstehung (wenn neue Balken erscheinen) bewegt. Dies wird besonders deutlich, wenn Sie die Anzeige der Hauptwellenlinie ausschalten (indem Sie ihre Farbe auf transparent schalten) und nur die Anzeige der Linien der Spur belassen. Siehe Folie 4.
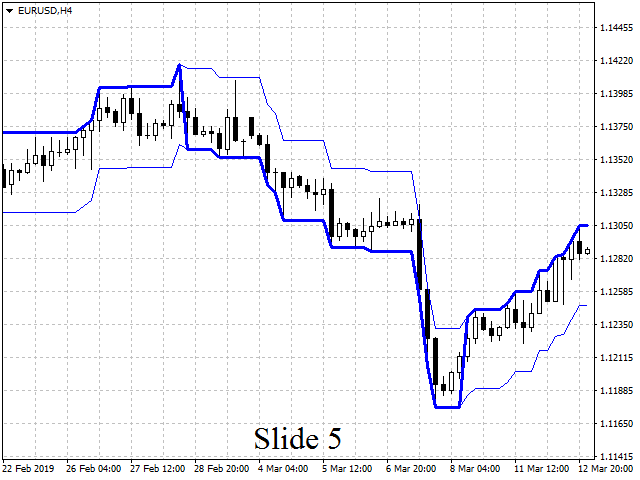
Zweitens zeigen die Spurlinien die Momente an, in denen eine Monowellenlinie unterbrochen wird, d. h. die Konstruktion des vorherigen Segments wird gestoppt und die Konstruktion eines neuen (entgegengesetzt gerichteten) Segments beginnt. Um dies besser zu erkennen, können Sie die Kurslinienanzeige des PPPC-Indikators zu den Kurslinien hinzufügen. Siehe Folie 5. Auf dieser Folie werden die Linien (d. h. die Grenzen) des Preiskanals durch dünne blaue Linien und die Linien des Kurses durch dicke blaue Linien dargestellt. Wie Sie auf dieser Folie sehen können, bewegen sich die Kurslinien immer entlang einer der Grenzen des Kanals (entweder nach oben oder nach unten), manchmal springen die Kurslinien von einer Kanalgrenze zur anderen. Im Moment eines solchen Sprungs bricht die Monowellenlinie: d.h. die Konstruktion des vorherigen Segments hört auf und die Konstruktion eines neuen (entgegengesetzt gerichteten) Segments beginnt. Wenn die Spurlinien beispielsweise von der unteren zur oberen Begrenzung des Kanals springen, hört die Konstruktion des vorherigen (abwärts gerichteten) Segments der Monowellenlinie auf und die Konstruktion eines neuen Segments beginnt aufwärts.
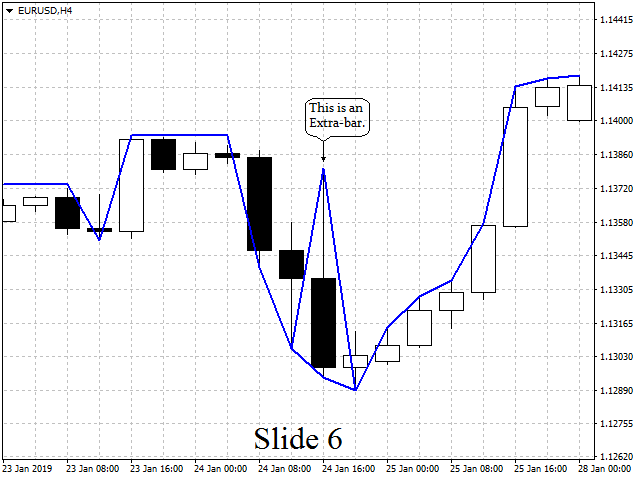
Drittens können die Linien der Spur gegabelt werden, wodurch ... (siehe weitere Beschreibung auf der Registerkarte Kommentare).
Unfortunately 2 indicators cannot appear on the same Tester chart, but the anyway, I prefer the price channel indicator for its breakout indication.
By the way, both indicators you are talking about are free. This means that no one bothers you to download and install them on the same chart (on a regular chart, not a tester one!). If you set the M1 timeframe on this chart, and in the parameters of both indicators specify the channel width (in points) approximately equal to the average candlestick size, then you will see the simultaneous operation of these indicators in real time (or, as you say, 'live').