MA Crossing
- Indikatoren
- Version: 1.2
- Aktualisiert: 24 März 2022
- Aktivierungen: 5

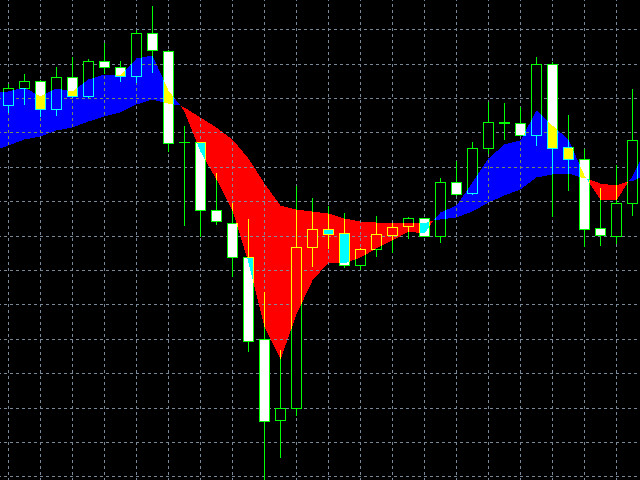
MA Crossing zeigt zwei gleitende Durchschnitte auf dem Diagramm an und malt ihre Kreuzungspunkte in verschiedenen Farben - blau (kaufen) und rot (verkaufen).
Der Indikator definiert eindeutig die Trendrichtung und -stärke und vereinfacht die Wahrnehmung der Marktsignale. Der Indikator kann in den Strategien nützlich sein, die die Methode der Kreuzung zweier gleitender Durchschnitte beinhalten.
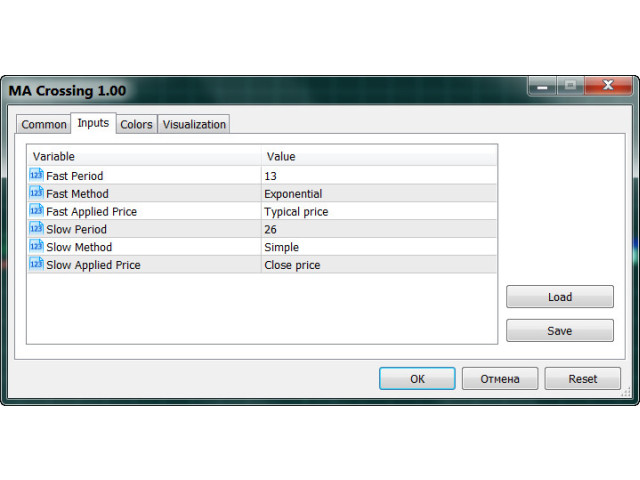
Mit den Eingabeparametern des Indikators können Sie die folgenden Einstellungen für jeden gleitenden Durchschnitt wählen:
- Periode (Schnelle Periode, Langsame Periode);
- Glättungsperiode (Einfach, Exponential, Geglättet, Linear gewichtet);
- angewandter Preis (Close, Open, High, Low, Median, Typical, Weighted).


Der Benutzer hat keinen Kommentar hinterlassen