MA Crossing
- Indicadores
- Versión: 1.2
- Actualizado: 24 marzo 2022
- Activaciones: 5

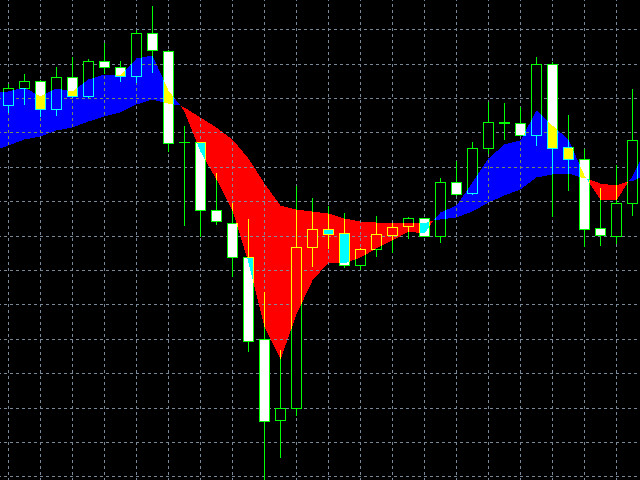
MA Crossing muestra dos medias móviles en el gráfico pintando sus puntos de cruce en diferentes colores: azul (compra) y rojo (venta).
El indicador define claramente la dirección y la fuerza de la tendencia y simplifica la percepción de las señales del mercado. El indicador puede ser útil en las estrategias que implican el método de cruce de dos medias móviles.
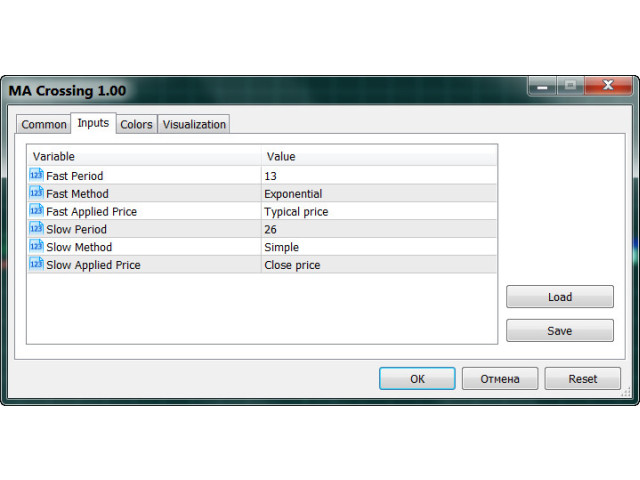
Los parámetros de entrada del indicador le permiten seleccionar los siguientes ajustes para cada media móvil:
- período (Período rápido, Período lento);
- periodo de suavizado (Simple, Exponencial, Suavizado, Lineal ponderado);
- precio aplicado (Cierre, Apertura, Máximo, Mínimo, Medio, Típico, Ponderado).


El usuario no ha dejado ningún comentario para su valoración