F Channel
- Indikatoren
- Version: 1.2
- Aktualisiert: 25 März 2022
- Aktivierungen: 5

F-Channel ist ein technischer Indikator, der den aktuellen Status des Devisenmarktes - Trend oder Flaute - definiert.
Der Indikator basiert auf dem FRAMA (Fractal Adaptive Moving Average). Der FRAMA folgt starken Trendbewegungen und verlangsamt sich deutlich während der Preiskonsolidierung.
Der Indikator kann auf allen Zeitrahmen arbeiten, aber H1 und höhere Zeitrahmen werden empfohlen, um falsche Signale zu minimieren.
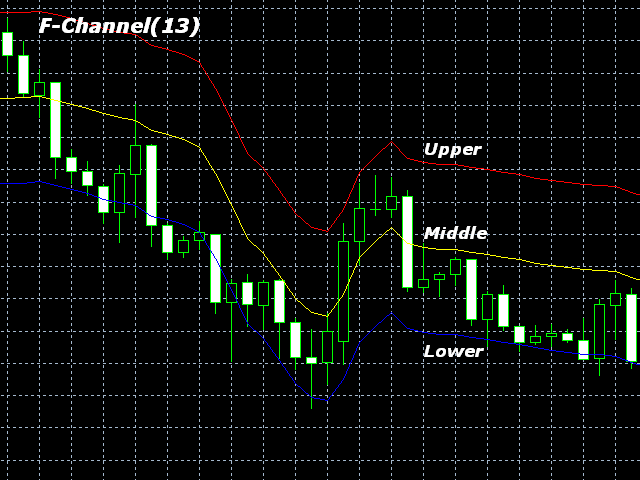
Der Indikator zeigt einen Kanal als Linien an, die sich oberhalb und unterhalb der mittleren Linie befinden. Die oberen und unteren Linien können als Widerstands- und Unterstützungsniveaus dienen.
Verkaufen Sie, wenn der Kurs die obere Linie erreicht, und kaufen Sie, wenn der Kurs die untere Linie erreicht.
Es wird empfohlen, einen kleinen Stop-Loss zu verwenden, um sich vor falschen Signalen zu schützen.
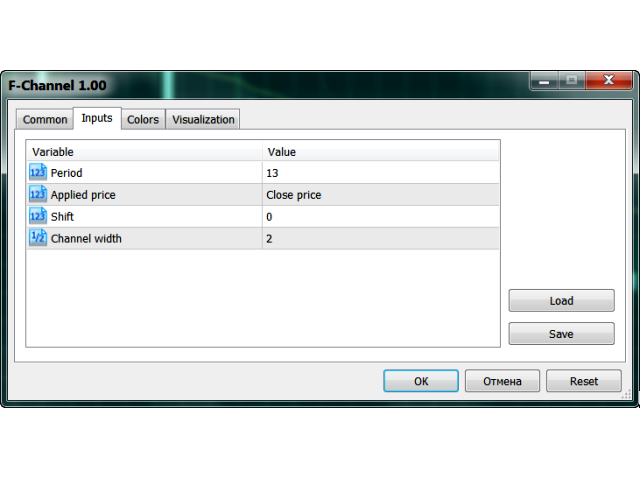
Auf der Registerkarte Eingaben des Indikators können Sie auswählen:
- den Zeitraum des Indikators;
- einen der sieben angewandten Preistypen (Close, Open, High, Low, Median, Typical, Weighted);
- horizontale Verschiebung aller Linien im Diagramm;
- Vertikale Verschiebung der oberen und unteren Linien im Verhältnis zur mittleren Linie.
Auf der Registerkarte Farben können Sie die Farbe, die Breite und den Linienstil des Indikators auswählen.
Parameter des F-Kanal-Indikators
- Periode - Anzahl der Balken, die für die Berechnung des Indikators verwendet werden;
- Angewandter Preis - wählen Sie aus den sieben angewandten Preistypen;
- Verschiebung - horizontale Verschiebung aller Linien auf dem Diagramm;
- Kanalbreite - vertikale Verschiebung der oberen und unteren Linien.
Der F-Kanal-Indikator wird nach den folgenden Formeln berechnet:
- Oberes Niveau = FRAMA(N,P) + Hoch(t)*CW/1000
- Unteres Niveau = FRAMA(N,P) - Tief(t)*CW/1000,
wobei:
- Upper Level - die obere Linie des Kanals;
- Lower Level - die untere Linie des Kanals;
- FRAMA - Fraktaler adaptiver gleitender Durchschnitt;
- N - Mittelungszeitraum;
- P - angewandter Preis (Close, Open, High, Low, Median, Typical, Weighted);
- High(t) und Low(t) - die Höchst- und Tiefstpreise der aktuellen Periode;
- CW - Kanalbreite (vertikale Verschiebung der oberen und unteren Linie im Verhältnis zur mittleren Linie).


Der Benutzer hat keinen Kommentar hinterlassen