MAPC
- Indikatoren
- Version: 1.1
- Aktualisiert: 26 März 2020

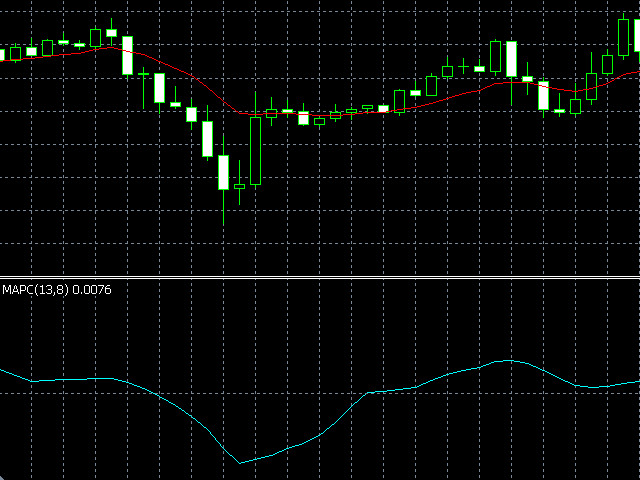
MAPC (Moving Average Percent's Change) zeigt die prozentuale Veränderung des gleitenden Durchschnitts von einer Periode zu einer anderen ausgewählten Periode an, so dass Sie die geglättete Preisänderungsrate verfolgen können.
MAPC wird nach der folgenden Gleichung berechnet:
MAPC[i] = 100 * (MA[i] - MA[i - n]) / MA[i],
wobei:
- MA[i] - aktueller Wert des gleitenden Durchschnitts;
- MA[i - n] - Wert des gleitenden Durchschnitts, der n Perioden vom aktuellen Wert des gleitenden Durchschnitts entfernt ist.
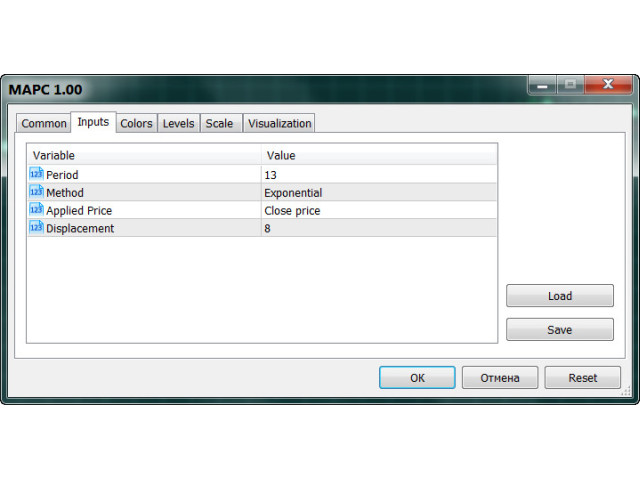
Eingabeparameter
- Periode - Periode des gleitenden Durchschnitts; Methode - Glättungsmethode (Einfach, Exponential, Geglättet, Linear gewichtet);
- Angewandter Preis - angewandter Preis (Close, Open, High, Low, Median, Typical, Weighted);
- Displacement - Verschiebung des gleitenden Durchschnitts von einer Periode zu einer anderen ausgewählten Periode (Displacement = n in der obigen Gleichung).
Hinweis: Wenn das Displacement kleiner als 1 oder größer als die Periode ist, erscheint die folgende Warnung: "Falscher Displacement-Wert. Indikator wird den Wert Displacement=Periode verwenden".


Der Benutzer hat keinen Kommentar hinterlassen