BeST Elliot Wave Oscillator Strategies
- Indikatoren
- Version: 1.20
- Aktualisiert: 13 November 2021
- Aktivierungen: 10

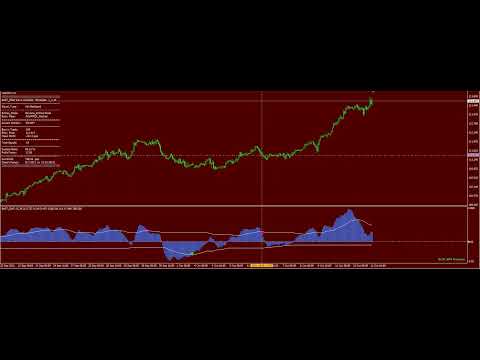
BeST_ Elliot Wave Oscillator Strategies ist ein MT4-Indikator, der standardmäßig die Differenz zweier SMAs darstellt, die als Histogramm angezeigt werden und um Null schwanken, während eine Signallinie Einstiegssignale entweder in einem umgekehrten oder in einem normalen Modus generiert, und es ist ein sehr leistungsfähiges Werkzeug, das sehr oft große Marktbewegungen ausnutzt.
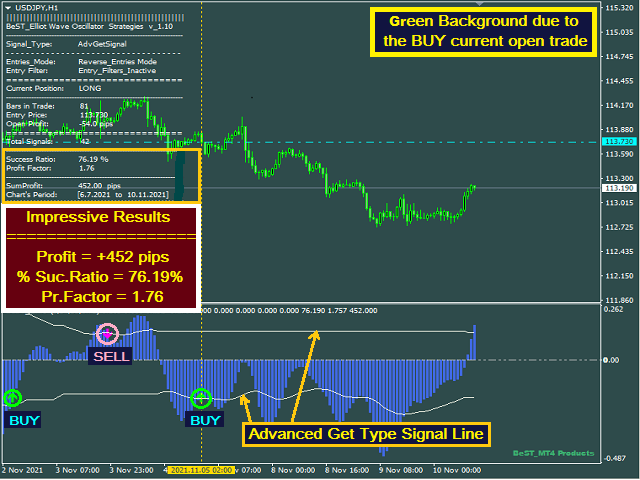
- Advanced Get Type - wie der entsprechende Typ, der im Paket Homonym Analysis verwendet wird
- Mov. Average Type - als gleitender Durchschnitt des Elliot Oscillators
Die Merkmale des Indikators
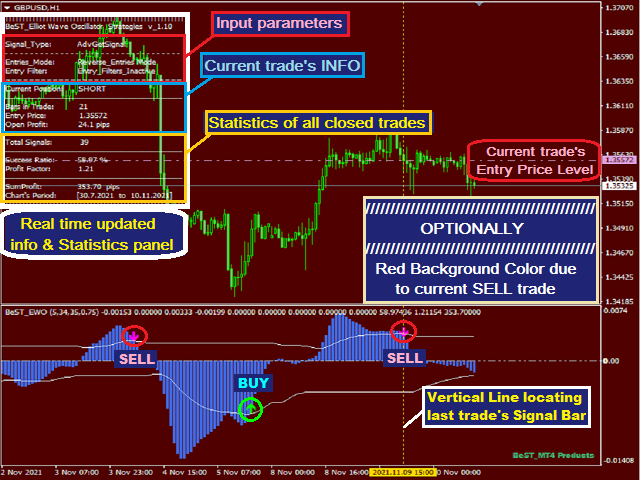
- Einfacher Handel mit klaren Einstiegssignalen, die als Pfeile an den Kreuzungspunkten des EWO und seiner Signallinie angezeigt werden
- Kein Nachmalen oder Zurückmalen von Signalen
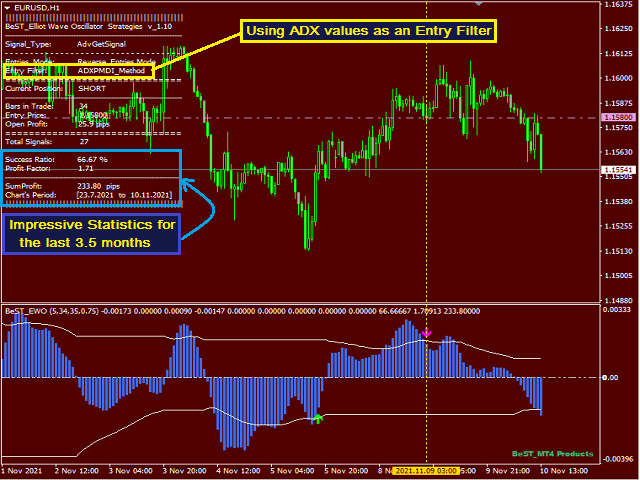
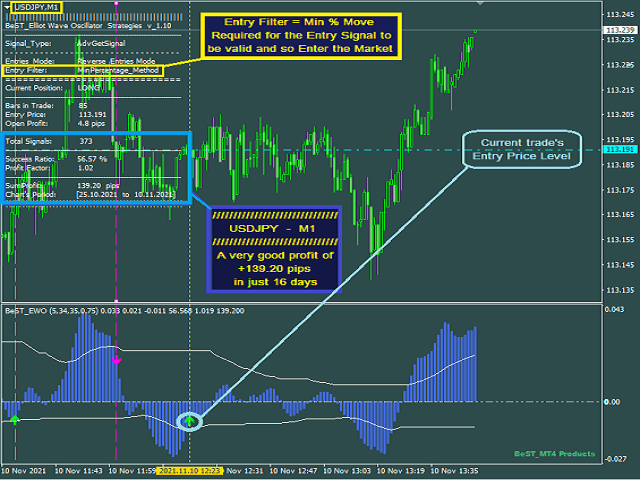
- Verwendet 4 auswählbare und vollständig konfigurierbare Entry-Filter (nur für den Reverse-Entries-Modus)
- Anpassbare Farben und Größen
- Es implementiert Performance-Statistiken (hauptsächlich für den Reversed Entries Modus)
- Es implementiert alle MT4-Warnungen (Ton/Nachricht, E-Mail, Push-Benachrichtigung)
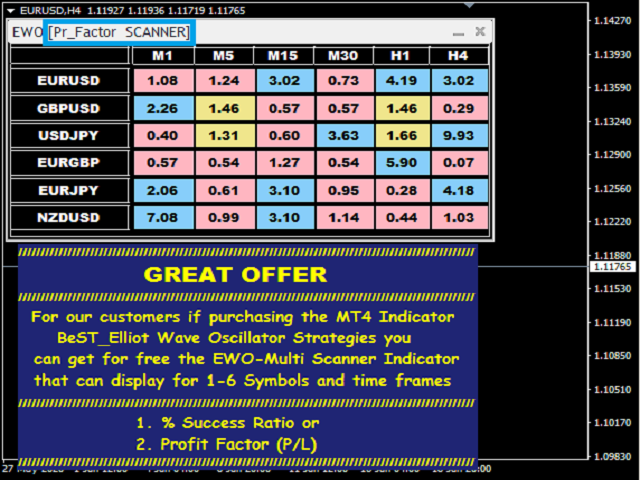
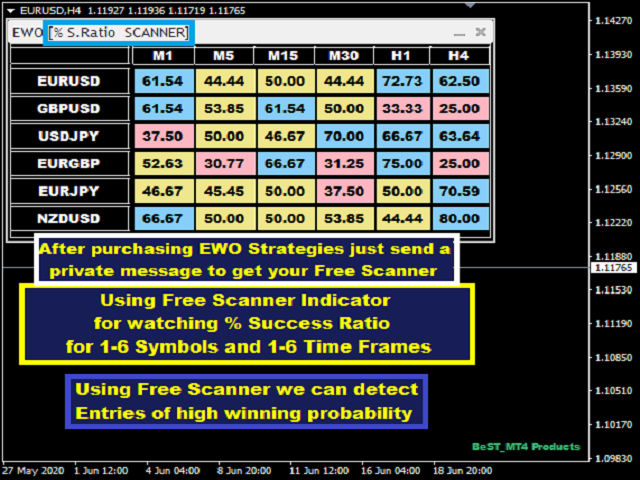
Sie können das Potenzial des Produkts maximieren, indem Sie unser Angebot für alle Kunden nutzen, die den Indikator bereits erworben haben. Dabei handelt es sich um einen sehr nützlichen Multi-Scanner-Indikator, der die %-Erfolgsquote und den Gewinnfaktor (P/L) anzeigt, um die vielversprechendsten Handels-Setups zu finden (Symbole und Zeitrahmen).
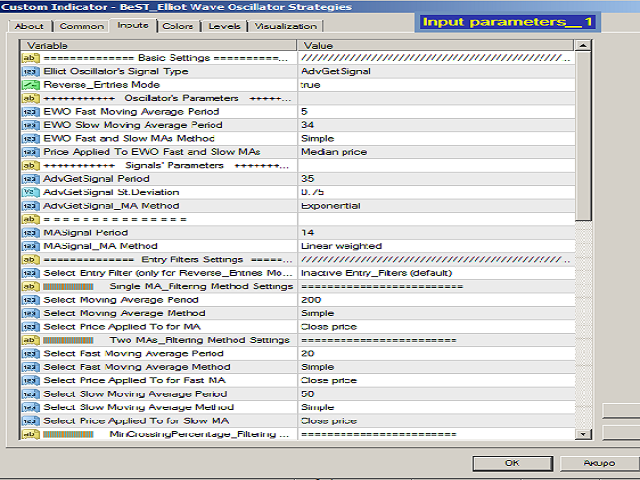
Eingabe-Parameter
=== Grundeinstellungen
- Elliot Oscillator's Signal Type - wählen Sie den Signaltyp
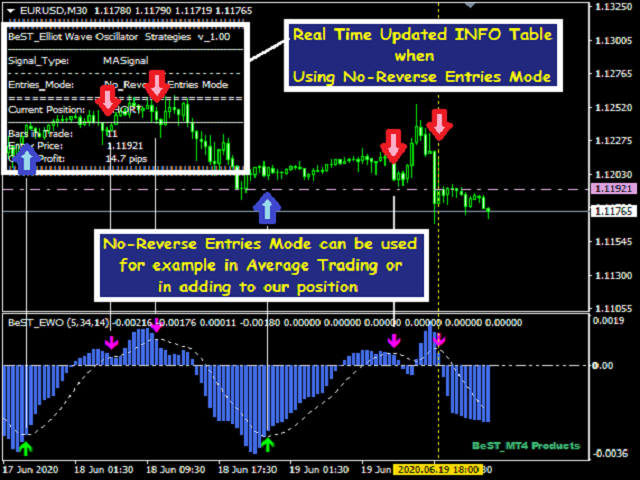
- Reverse_Entries Mode - wählen Sie den Entries Mode (Reverse oder Normal)
- Oszillator-Parameter - wählen Sie MAs, die EWO-Parameter bilden
- Parameter der Signale - wählen Sie die Parameter der Signallinien
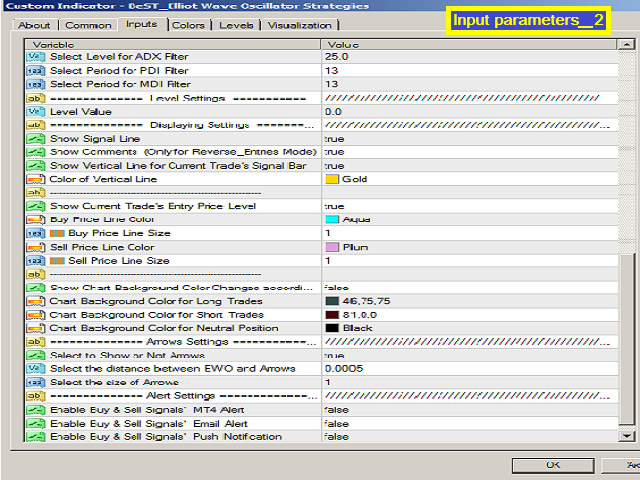
=== Einstellungen für Entry-Filter
- Entry_Filter - Filtertyp auswählen( standardmäßiginaktiv )
- Einzelne MA_Filtermethode Einstellungen
- Zwei MA_Filtermethode Einstellungen
- MinCrossingPercentage_Filtermethode Einstellungen
- ADXPMDI_Filtermethode Einstellungen
- Pegelwert - wählen Sie den Pegelwert des Oszillators (standardmäßig die Null-Linie)
=== Anzeigeeinstellungen - wählen Sie aus, welche Chart-Objekte und Features angezeigt/aktiviert werden sollen und wählen Sie die Farbe, Größe und Abstände der gezeichneten Objekte
=== Pfeileinstellungen - wählen Sie Einstiegspfeile / Signalmerkmale
=== Alert-Einstellungen - zur Steuerung der Verwendung aller MT4 Alerts
- Kauf-Pfeile: Puffer = 2
- Verkaufspfeile: Puffer = 3