BeST Chande TrendScore Indicator
- Indikatoren
- Version: 1.0
- Aktivierungen: 10

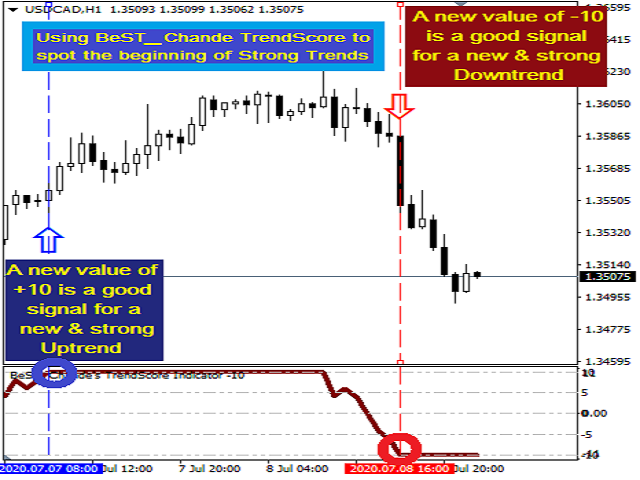
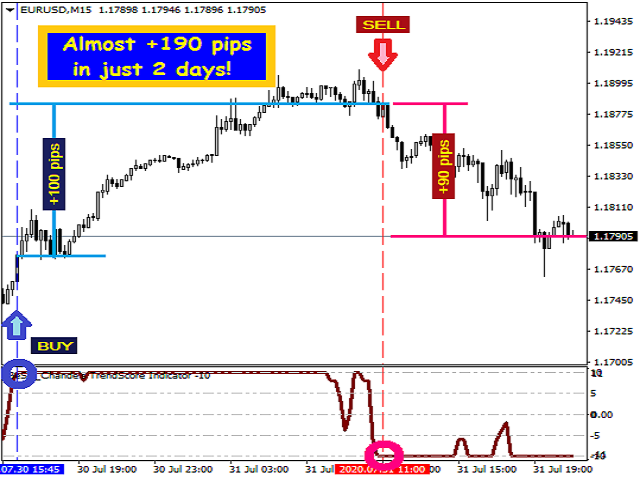
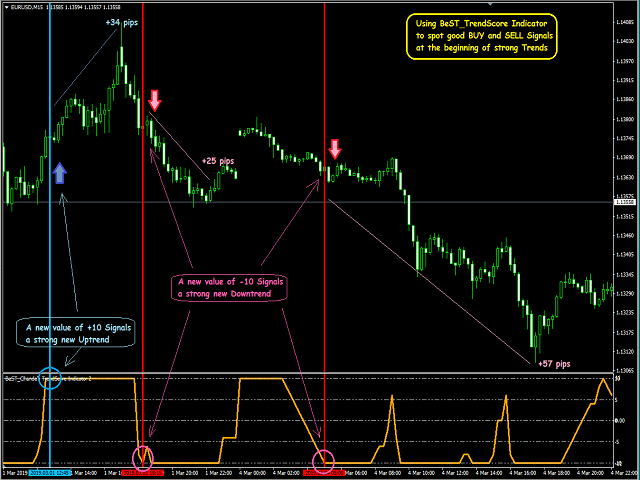
Der BeST_Chande TrendScore Indikator zeigt den Beginn eines Trends mit hoher Genauigkeit an und eignet sich hervorragend für das Scalping auf dem 1-Minuten-Zeitrahmen. Er ist auch eine einfache Möglichkeit, die Trendstärke zu bewerten. Er zeigt sowohl die Richtung als auch die Stärke eines Trends an und kann leicht mit verschiedenen Trendfolge-, Swing- und Scalping-Strategien kombiniert werden:Ein Wert von +10 signalisiert einen starken Aufwärtstrend, ein Wert von -10 einen starken Abwärtstrend. Im Allgemeinen zeigt ein positiver Wert einen Aufwärtstrend an, während ein negativer Wert einen Abwärtstrend anzeigt. Der TrendScore ist während größerer Teile der Aufwärtsbewegung auf +10 und während größerer Teile der Aufwärtsbewegung auf -10 fixiert, während er in Seitwärtsphasen schnell die Richtung wechselt.
TrendScore-Indikator
- ist hervorragend für den Trendhandel geeignet
- eignet sich hervorragend für den Swing-Handel
- eignet sich hervorragend für Scalping
- malt nicht nach
- funktioniert auf jedem Zeitrahmen
- funktioniert mit jedem Symbol
- ist einfach und leicht zu bedienen
Der TrendScore-Indikator wurde von Tushar S. Chande entwickelt, der in seinem Artikel in Stocks & Commodities: "Rating Trend Strength" alles über seine Verwendung erklärt.
Der TrendScore-Indikator kann auf viele Arten gehandelt werden. Welchen Ansatz wir wählen, hängt von unserem Handelsstil ab:
- Sie können den Nulldurchgang als frühes Signal nutzen und dann kaufen, wenn der TrendScore positiv oder gleich +10 wird, und verkaufen, wenn er negativ oder gleich -10 wird.
- Als Filter können Sie auch ein bis drei Balken warten, nachdem der TrendScore +10 oder -10 erreicht hat, bevor Sie kaufen (+10) oder verkaufen (-10).
- Oder Sie können den TrendScore mit einem gleitenden Durchschnitt kombinieren und einen Crossover nach oben oder unten handeln.
- Eine andere Variante wäre, dass Sie kaufen, wenn der TrendScore von -10 auf über +5 steigt, und dass Sie verkaufen, wenn der TrendScore von +10 auf unter 5 fällt.
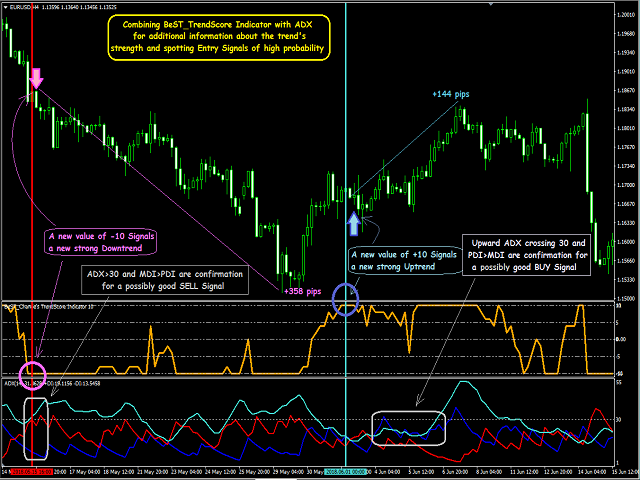
Sie können den TrendScore auch mit anderen Indikatoren für die Trendstärke kombinieren. Wenn Sie den TrendScore beispielsweise mit dem ADX-Indikator kombinieren, gibt der TrendScore einen Hinweis auf die Richtung, während der ADX zusätzliche Informationen über die Stärke des Trends liefern kann . Sie könnten beispielsweise auchH1-Daten verwenden, um den Score eines Trends zu berechnen und auf der Grundlage eines niedrigeren Zeitrahmens wie M15, M5 oder M1 usw. zu handeln.
Eingaben
Die einzigen Eingabeparameter des Indikators sind die folgenden:
- Farbe des TrendScore-Indikators auswählen
- Wählen Sie die Breite des TrendScore-Indikators
Für EA-Entwickler
TrendScore-Puffer = 1