BeST Classic Pivot Points
- Indikatoren
- Version: 1.0

BeST_ Classic Pivot Points ist ein MT4-Indikator, der auf dem weithin bekannten und durchaus klassischen Pivot-Punkt eines Marktpreisgeschehens basiert.
Ein Pivot-Punkt wird als Durchschnitt von signifikanten Kursen (Hoch, Tief, Schluss) aus der Performance eines Marktes in der vorherigen Handelsperiode berechnet. Wenn der Markt in der folgenden Periode oberhalb des Pivot-Punktes handelt, wird dies in der Regel als bullische Stimmung gewertet, während ein Handel unterhalb des Pivot-Punktes als bearisch angesehen wird.
Ein Pivot-Punkt und die damit verbundenen Unterstützungs- und Widerstandsniveaus sind oft Wendepunkte für die Richtung der Kursbewegung in einem Markt.
In einem Aufwärtsmarkt können der Pivot-Punkt und die Widerstandsniveaus eine Preisobergrenze darstellen, oberhalb derer der Aufwärtstrend nicht mehr aufrechtzuerhalten ist und es zu einer Umkehr kommen kann; in einem Abwärtsmarkt können der Pivot-Punkt und die Unterstützungsniveaus ein niedriges Preisniveau der Stabilität oder einen Widerstand gegen einen weiteren Rückgang darstellen ( Wikipedia).
Die Berechnung für einen PP und die dazugehörigen S & R Levels ist unten dargestellt:
- Pivot-Punkt (PP) = (Hoch + Tief + Schluss)/3
- Erster Widerstand (R1) = (2 x PP) - Tief
- Erste Unterstützung (S1) = (2 x PP) - Hoch
- Zweiter Widerstand (R2) = PP + (Hoch - Tief)
- Zweite Unterstützung (S2) = PP - (Hoch - Niedrig)
- Dritter Widerstand (R3) = Hoch + 2(PP - Tief)
- Dritte Unterstützung (S3) = Tief - 2(Hoch - PP)
Der Handel mit Pivot-Punkten ist die ultimative Unterstützungs- und Widerstandsstrategie, die die Subjektivität des manuellen Einzeichnens von S- und R-Niveaus beseitigt.
Eingabe-Parameter
Grundlegende Einstellungen
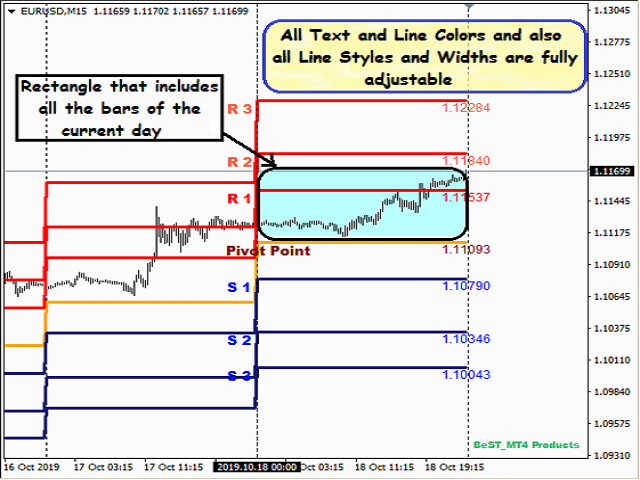
- Select Current Day's Rectangle Color - zur Auswahl der Farbe des Rechtecks, das alle Balken des aktuellen Tages einschließt
- Select Current Day's Vertical Line Color - für die Auswahl der Farbe der vertikalen Linie, die den Startzeitpunkt des aktuellen Tages angibt
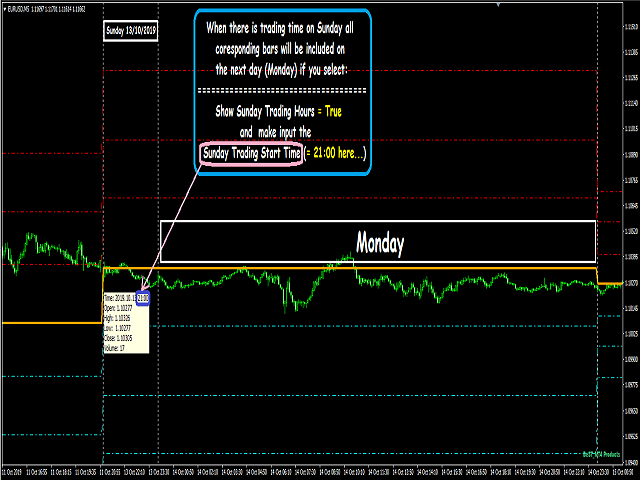
- Sonntagshandelszeiten anzeigen - true, wenn es auf unserem Chart Handelsbalken zu einer bestimmten Stunde des Sonntags gibt, andernfalls false
- Startzeit des Sonntagshandels - für die Eingabe der genauen Zeit, zu der der Handel beginnt
Pivots-Einstellungen
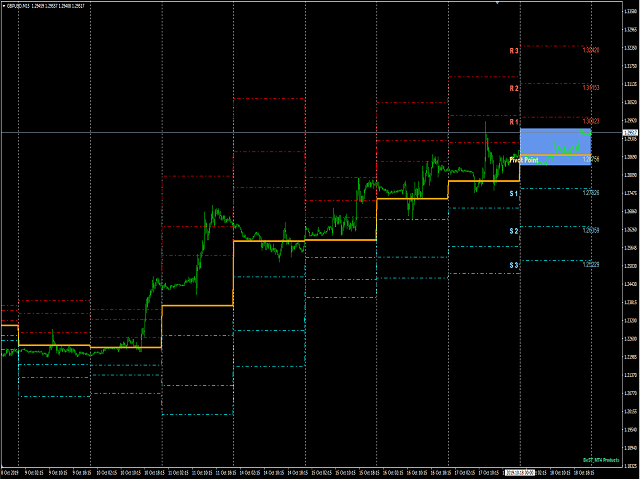
Zur Auswahl von Farbe, Stil und Größe der gezeichneten Linien und des Textes.


Der Benutzer hat keinen Kommentar hinterlassen