BeST Fibonacci Retracement Lines
- Indikatoren
- Version: 1.0
- Aktivierungen: 10

BeST_Fibonacci Retracement Lines ist ein MT4-Indikator, der standardmäßig auf den üblichen Fibonacci-Levels basiert, aber auch 3 beliebige Retracement- oder Support-Levels einer Trendbewegung einzeichnen kann. Er kann verwendet werden, um Pullback-Punkte zu identifizieren, aber auch zusätzlich als eine Art Trailing Stop.
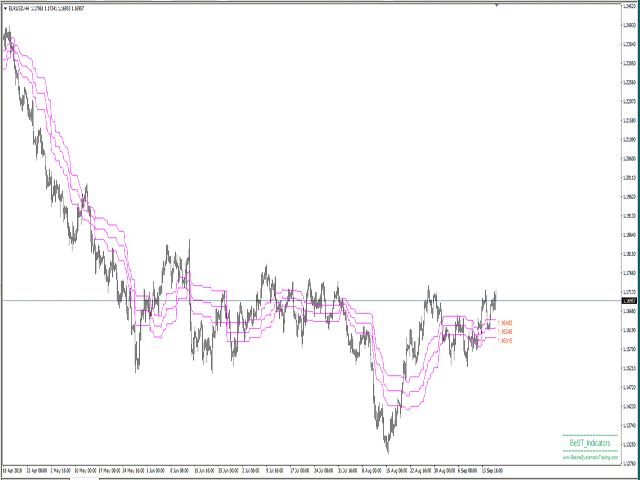
BeST_Fibonacci Retracement-Linien Indikator:
- zeichnetstandardmäßig 38,2%, 50% und 61,8% Retracement Levels der aktuellen Kursbewegung, die durch das höchste Hoch (HH) und das niedrigste Tief (LL) einer gewünschten Rückblicksperiode definiert werden.
-Er kann auch 3 beliebige Retracement- oder Unterstützungsniveaus der aktuellen Bewegung einzeichnen.
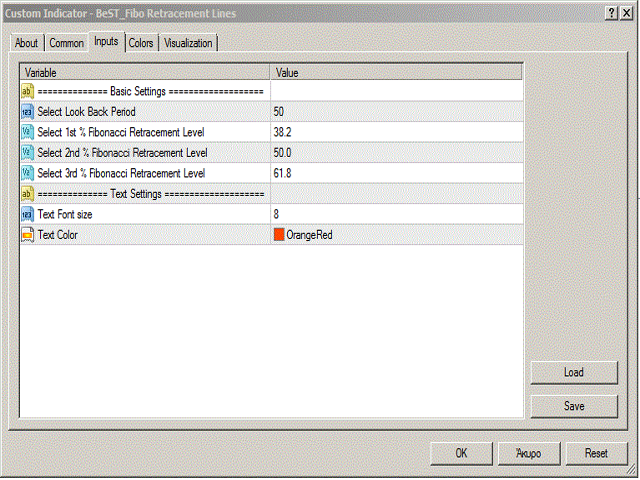
Eingaben
Die Eingabeparameter des Indikators sind die folgenden:
-Wählen Sie die Rückblick-Periode: Das ist die Anzahl der Balken, die wir auf dem Chart zurückblicken und HH und LL definieren, um die % Retracement Levels zu berechnen.
-Wählen Sie das1.,2. und3. Fibonacci Retracement Level: Sie können 3 beliebige % Retracement Levels der aktuellen Bewegung auswählen, die gezeichnet werden sollen.
-Wählen Sie Schriftgröße und -farbe: Sie können die Texteinstellungen für die gezeichneten Levels auswählen.