Relative Strength Levy Classic
- Indikatoren
- Version: 1.1
- Aktualisiert: 21 Mai 2020
- Aktivierungen: 5

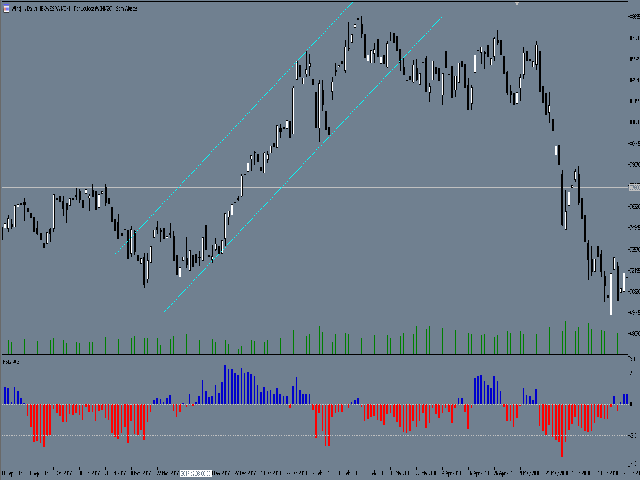
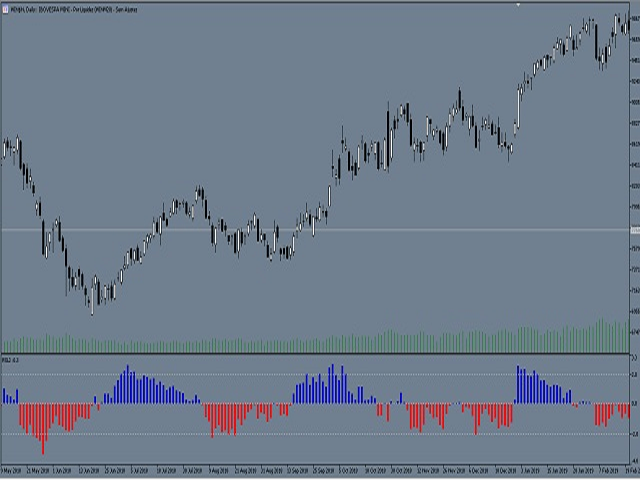
Klassische RSL
Dies ist der klassische Indikator "Relative Strength Levy" (RSL), der auf die Studie von Dr. Robert Levy mit dem Titel "The Relative Strength Concept of Common Stock Pricing" zurückgeht, die in den späten 60er Jahren des letzten Jahrhunderts als gebundenes Buch veröffentlicht wurde.
Schlüsselkonzept
Verwenden Sie diesen Indikator für verschiedene Instrumente, um deren relative Stärke zu vergleichen: Die resultierenden Analysewerte schwanken um 1
Die stärksten Instrumente haben die höchsten RSL-Werte (über 1) und die schwächsten Instrumente die niedrigsten RSL-Werte (unter 1)
Sie können die stärksten Instrumente (höchste RSL-Werte) kaufen und die schwächsten Instrumente (niedrigste RSL-Werte) verkaufen, um Trends zu folgen.
Ressourcen
Funktioniert für alle Fristen
Funktioniert für alle Instrumente, die in Ihrem MetaTrader 5 Market Watch Fenster verfügbar sind
Der Pufferausgangswert wird in einem separaten Indikatorfenster und im Datenfenster angezeigt.
Der Indikator kann in Expert Advisors mit der Funktion iCustom () für automatisierte Handelssysteme verwendet werden.
Wie Dr. Levy RSL verwendete
Dr. Levy analysierte wöchentlich 200 US-Aktien (man denke an den S&P 200) und nutzte den Ausgabewert seines RSL-Indikators, um eine Rangliste der stärksten Aktien (höchste RSL-Werte > 1) und der schwächsten (niedrigere RSL-Werte < 1) zu erstellen. Von dieser sich ergebenden Rangliste kaufte er die 5 % bis 7 % der Aktien mit dem höchsten RSL-Wert. Nach einer Woche überprüfte er erneut alle 200 Aktien und ordnete sie erneut nach dem RSL-Wert.
Fiel eine Aktie auf die untersten 31 % dieser neu eingestuften Liste (er nannte es "Casting Rank"), verkaufte er die Aktie und verteilte dann das freie Kapital wieder in die 5 % bis 7 % der jüngsten Rangliste. So hat er immer in die stärksten verfügbaren Aktien investiert und sein Kapital wöchentlich umgeschichtet, entsprechend der RSL-Rangliste. Dies ist ein klassischer "Momentum"-Ansatz und wird für mittel- und langfristig orientierte Anleger empfohlen.
Autor
Ursprüngliches Konzept von Dr. Robert A. Levy (1968).
Der Benutzer hat keinen Kommentar hinterlassen