Candle Pattern Scanner
- Indikatoren
- Version: 1.0
- Aktivierungen: 5

Candlestick-Muster
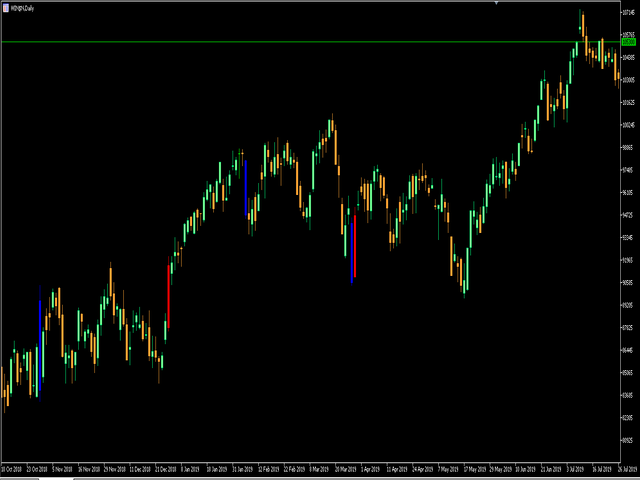
Der Candlestick-Pattern-Indikator und -Scanner wurde entwickelt, um ein komplettes Hilfsmittel für diskretionäre Händler zu sein, um Charts mit leistungsstarken Kerzenmustern zu finden und zu analysieren.
Erkannte Patterns:
Hammer
Sternschnuppe
Bearish Engulfing
Bullish Engulfing
Doji
Marubozu
Scanner
Stellen Sie sich vor, Sie könnten alle Marktwerte in allen Zeitrahmen auf der Suche nach Candlestick-Signalen betrachten.


Der Benutzer hat keinen Kommentar hinterlassen