Color Trend
- Indikatoren
- Version: 1.0

Der Candle Color Trend kombiniert das Beste aus Price Action, direktionaler Bewegung und Divergenz-/Konvergenzanalyse und ist eine einfache und zuverlässige Methode, um die Richtung des Trends zu erkennen.
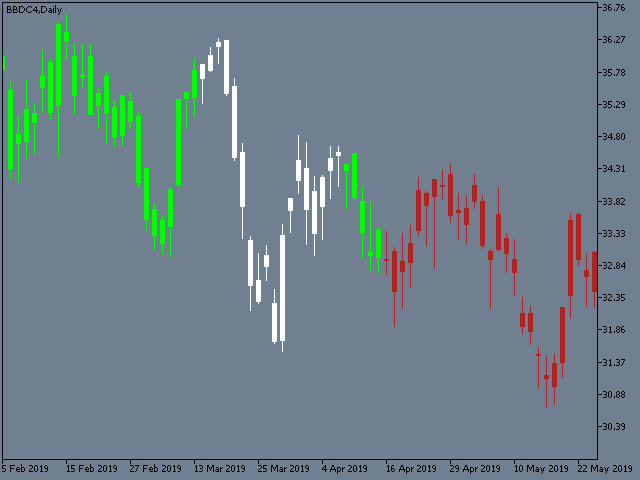
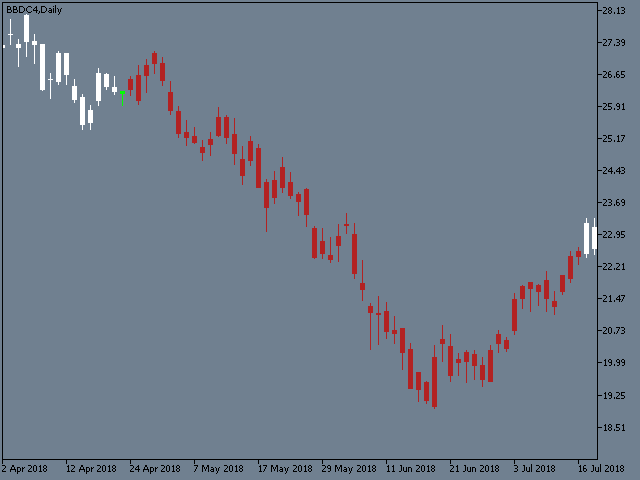
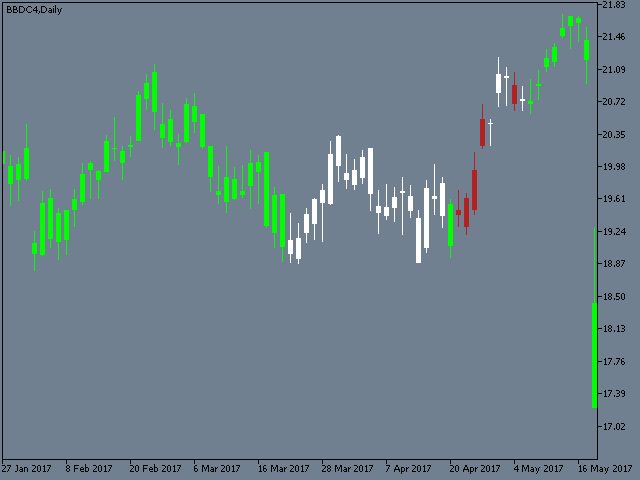
Der Indikator malt die Kerzen automatisch nach der Prämisse, dass der Aufwärtstrend durch Preise definiert wird, die eine Reihe von aufsteigenden Höchst- und Tiefstständen bilden. Andererseits wird der Abwärtstrend durch Preise definiert, die eine Reihe von absteigenden Höchst- und Tiefstständen bilden.
Color Trend ist sicherlich einer der besten Filter für Ihre Trendfolgestrategie, aber als einzelnes Eingangssignal ist er nicht zu empfehlen.