VolumeCapacitor
- Indikatoren
- Version: 1.7
- Aktualisiert: 10 Juni 2020
- Aktivierungen: 5

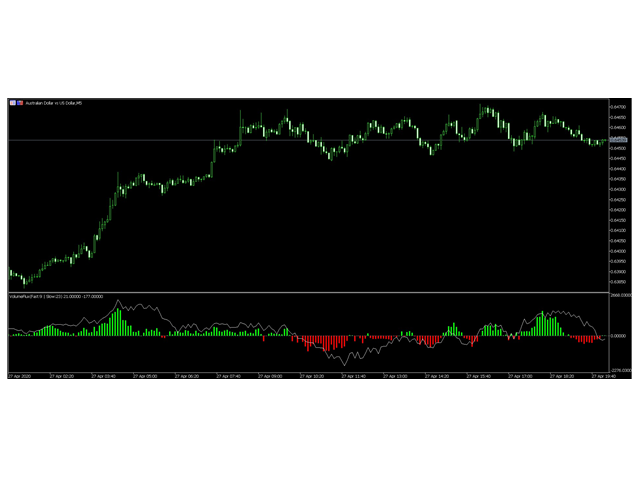
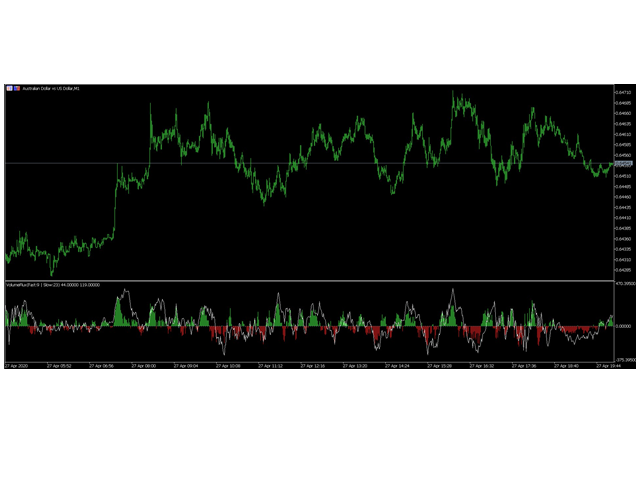
VolumeCapacitor wurde von Fábio Trevisan entwickelt und ist ein Indikator, der nicht nur die Menge des Volumens anzeigt, sondern auch dessen Richtung, wobei das Hauptmerkmal die möglichen Höchst- und Tiefststände oder Pullback-Bereiche sind. Mit seiner einfachen, aber nicht simplen Berechnungsmethode ist er in der Lage, Bereiche zu bestimmen, in denen die Verteidigung von Long- und Short-Positionen mit einer einfachen Beobachtung beurteilt werden kann. VolumeCapacitor verwendet in seiner einzigartigen Formel das OBV (Balance of Volume oder On-Balance Volume), das von Joseph Granville idealisiert wurde, auf einzigartige Weise. Durch die Anpassung der Perioden des VolumeCapacitor (Fast für das Histogramm, Slow für die Linie), erhält man eine Ablesung in verschiedenen Zeitrahmen, was die Ablesung des Volumenflusses erleichtert.
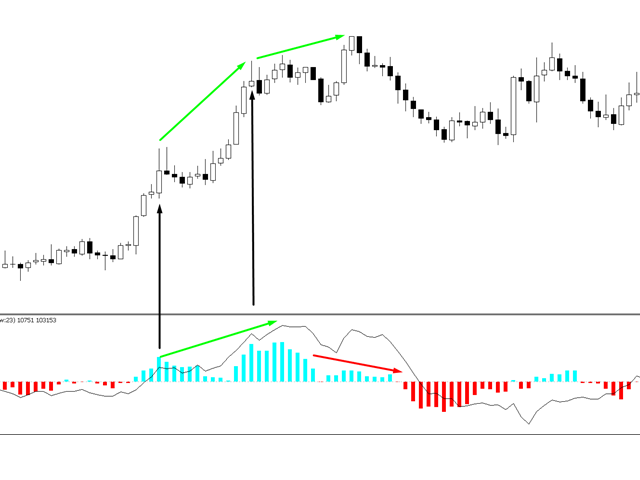
Die Grundannahme in Bezug auf die On Balance Volume-Analyse ist, dass Veränderungen im OBV Veränderungen in den Preisen vorausgehen. Der Theorie zufolge kann man beobachten, dass intelligentes Geld in Vermögenswerte fließt, wenn das OBV steigt. Wenn die Öffentlichkeit an einem Vermögenswert interessiert ist, gewinnen sowohl der Preis des Vermögenswerts als auch das OBV an Dynamik. Wenn die Preisbewegung des Vermögenswerts der OBV-Bewegung vorausgeht, dann wurde eine "unbestätigte Bewegung" erzeugt. Unbestätigte Bewegungen können in Hausse-Märkten (wenn der Vermögenswert vor oder ohne das OBV steigt) oder in Baisse-Märkten (wenn der Vermögenswert vor oder ohne den technischen Indikator On Balance Volume fällt) auftreten.
Das OBV befindet sich in einem Aufwärtstrend, wenn jedes neue Hoch größer ist als sein Vorgänger und jedes neue Tief größer als das vorherige. Ebenso befindet sich das On-Balance-Volumen in einem Abwärtstrend, wenn jeder neue Höchststand geringer ist als sein Vorgänger und jeder neue Fonds geringer ist als sein Vorgänger. Wenn sich das OBV seitwärts bewegt und keine aufeinanderfolgenden Höchst- und Tiefststände bildet, befindet es sich in einem zweifelhaften Trend. Ist ein Trend einmal etabliert, bleibt er so lange in Kraft, bis er gebrochen wird. Es gibt zwei Möglichkeiten, wie der Trend des On Balance Volume gebrochen werden kann. Der erste Fall tritt ein, wenn der Trend von einem Aufwärtstrend zu einem Abwärtstrend oder von einem Abwärtstrend zu einem Aufwärtstrend wechselt.
Die zweite Möglichkeit, den OBV-Trend zu brechen, besteht darin, dass der Trend in einen zweifelhaften Trend umschlägt und mehr als drei Tage lang so bleibt. Wenn also der Vermögenswert von einem Aufwärtstrend zu einem zweifelhaften Trend wechselt und dies nur zwei Tage anhält, bevor er wieder zu einem Aufwärtstrend zurückkehrt, wird davon ausgegangen, dass sich das On Balance Volume immer in einem Aufwärtstrend befunden hat. Wenn das OBV in einen Aufwärts- oder Abwärtstrend übergeht, liegt ein "Bruch" vor. Da Unterbrechungen des OBV im Allgemeinen Preisunterbrechungen vorausgehen, sollten Anleger langfristig kaufen, wenn das On Balance Volume nach oben ausbricht. Ebenso müssen Anleger Leerverkäufe tätigen, wenn das OBV nach unten bricht. Die Positionen sollten beibehalten werden, bis sich der Trend ändert.
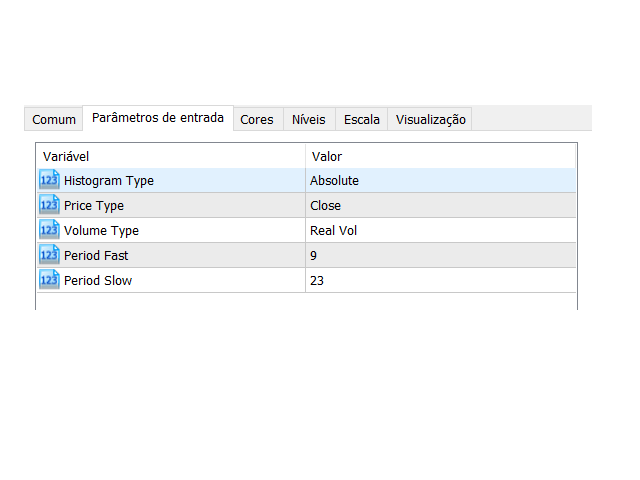
Zur intelligenten Berechnung des OBV verfügt der Indikator über verschiedene Preisparameter, und zwar
- Schlusskurs (Standard)
- Eröffnung
- Höchstwert
- Minimum
- (Eröffnung + Schlusskurs) / 2
- (Maximum + Minimum) / 2
- (Maximum + Minimum + Schlusskurs) / 3 oder Typischer Preis
- (Maximum + Minimum + Eröffnung + Schließung) / 4
Es hat auch die Fähigkeit, ABSOLUTE oder PERCENTAGE Variation, zusätzlich zu den verschiedenen Arten von Volumen zu plotten: REAL oder TICKS.


Der Benutzer hat keinen Kommentar hinterlassen