VWAPBands
- Indikatoren
- Version: 1.6
- Aktualisiert: 24 Juni 2020
- Aktivierungen: 5

- Wählen Sie das Symbol und die gewünschte Grafikzeit;
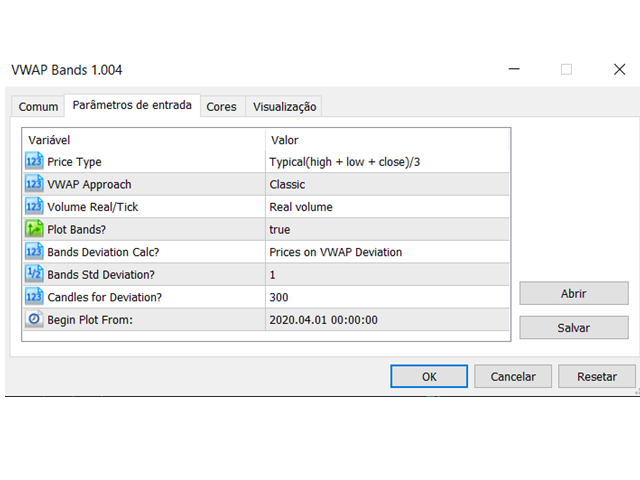
- Wählen Sie den Preistyp, der für die Berechnung des gewünschten VWAP am besten geeignet ist;
- Wählen Sie, ob die Bänder dargestellt werden sollen oder nicht;
- Wählen Sie die Art des Volumens, das Sie verwenden möchten (Ticks oder Real);
- Wählen Sie die Art der Berechnung der Bänder (Abweichung der Preise, Abweichung der Preise im Verhältnis zum VWAP, Abweichung des täglichen VWAP, Abweichung des Preises im Verhältnis zum VWAP des Dollars auf einer annualisierten Tick-Basis);
- Wählen Sie, wie viele Abweichungen Sie für die Darstellung der Bänder verwenden möchten;
- Wählen Sie, wie viele Kerzen Sie für die Berechnung der Abweichungen verwenden möchten;
- Bestimmen Sie im Parameter "Begin Plot" das Datum und die Uhrzeit der BASE-Kerze;
- Bestimmen Sie im Parameter "MIDAS" den Parameter VWAP Approach;
- Bestimmen Sie die Art der Preise wie HIGH für Upper Midas, LOW für Lower Midas;
- Okay, Sie haben die Unterstützung/Widerstand durch die MIDAS-Methode. Verwenden Sie die Bänder, um bessere Regionen zu erhalten.
Schließlich können Sie auch den VWAP des letzten HIGH VOLUME-Balkens aus dem im Feld "Begin Plot" ausgewählten Zeitraum erhalten:
- Bestimmen Sie im Parameter "Begin Plot" das Startdatum der Kerze mit dem höchsten Volumen;
- Bestimmen Sie den VWAP Annäherungsparameter für "Highest Volume Bar";
- Andere Parameter nach dem Geschmack des Benutzers;
- Der Plot wird ab der jüngsten Kerze mit dem höchsten Volumen erstellt, alle davor liegenden Kerzen werden ignoriert.
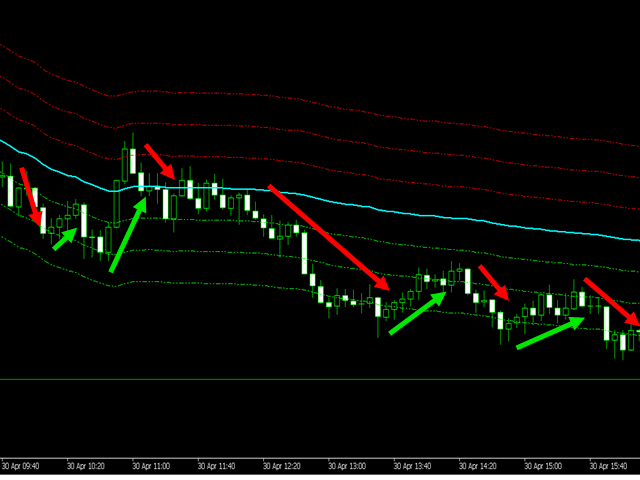
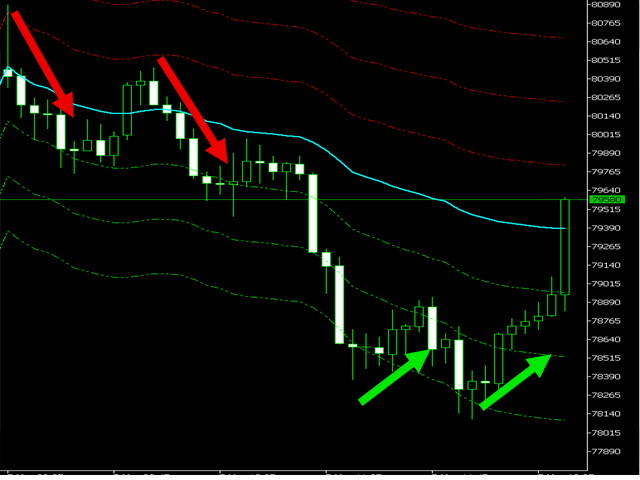
VWAP ist eine Abkürzung für Volume Weighted Average Price (volumengewichteter Durchschnittspreis). Es handelt sich also um einen Durchschnitt der in einem bestimmten Zeitraum ausgehandelten Preise, gewichtet nach dem Volumen, das zu diesen Preisen gehandelt wurde, und dient für viele als "Kampfwert", da die Akteure, die diesen Durchschnittspreis gebildet haben, kein Interesse daran haben, ihren Durchschnittspreis zu "verlieren". Die Bänder sind die Punkte, die wir für das Betreten und Verlassen Operationen, je nach ihren Betrieb, auch als Preis Unterstützungen / Widerstände dienen können.
Dieser Indikator schließt die aktuellen Candlestick-Daten ein, was bedeutet, dass Sie immer die neuesten Werte erhalten!