Colored Adaptive Moving Average AMA
- Indikatoren
-
Flavio Javier Jarabeck
 We are a closed brotherhood of traders whose ultimate goal is to profit through well-studied, structured, and automated trades. As a result, we publish dozens of MT5 indicators (FREE and paid) to the global MQL5 community. 80% of our published products are high-quality free indicators so beginner
 - Version: 1.0
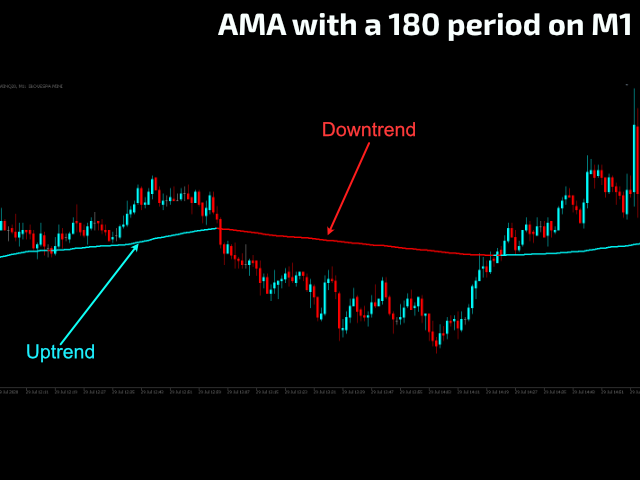
Wenn Sie gerne traditionelle gleitende Durchschnitte (wie SMAs und EMAs) verwenden, um Ihre Trades mit dynamischen Unterstützungs- und Widerstandsniveaus zu versehen, werden Sie den Adaptiven Gleitenden Durchschnitt (AMA) lieben. Der Adaptive Moving Average (auch bekannt als KAMA - Kaufman Adaptive Moving Average) wurde 1995 von Perry Kaufman entwickelt und in seinem Buch"SmarterTrading: ImprovingPerformanceinChangingMarkets" der Weltöffentlichkeit vorgestellt. Er hat sich zum Ziel gesetzt, der perfekte Begleiter zu sein, um einem Trend ohne Rauschen zu folgen, aber dennoch glatt und schnell genug, um für den Händler nützlich zu sein.
Der AMA passt sich selbst an, wenn sich die Kursschwankungen ausweiten (die Volatilität nimmt zu), und gleichzeitig folgt der AMA den Kursen in einer ruhigen Marktphase nah genug, um Ihnen das Beste aus beiden Welten zu bieten, indem er als allgemeiner Trendstatus sowie als dynamische Unterstützungs- und Widerstands- und Momentum-Wendepunkte fungiert.
Es gibt einen ausgezeichneten Artikel über die schrittweise Berechnung der AMA, wenn Sie weitere Informationen benötigen:
https://school.stockcharts.com/doku.php?id=technical_indicators:kaufman_s_adaptive_moving_average
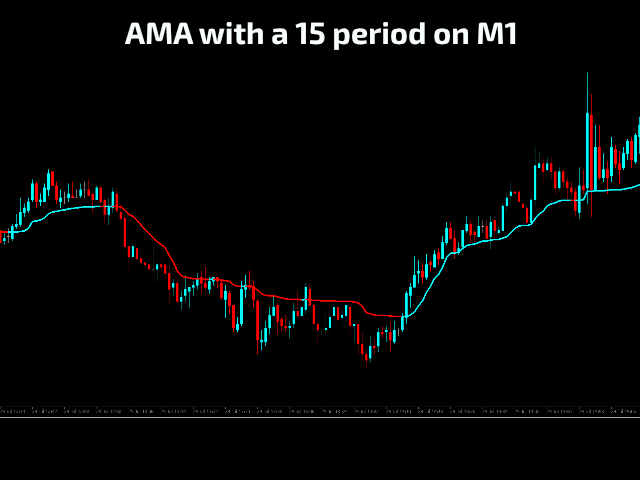
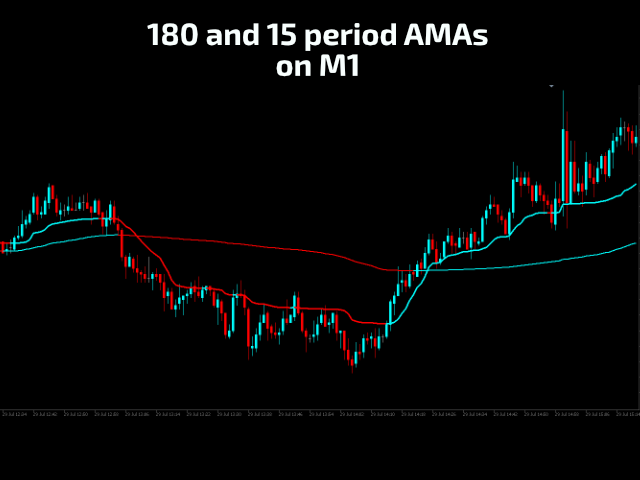
Da es bei der Festlegung von gleitenden Durchschnitten KEIN Richtig oder Falsch gibt, müssen Sie die AMA auf das Symbol, den Zeitrahmen und die Strategie abstimmen, die Sie verwenden möchten, um eine perfekte Anpassung für Ihre Trades zu erreichen. Diese Version des AMA ist farbig, so dass Sie einen konfigurierbaren 2-Farben-Satz haben, wenn sich der AMA in einem Aufwärts- oder Abwärtstrend befindet.
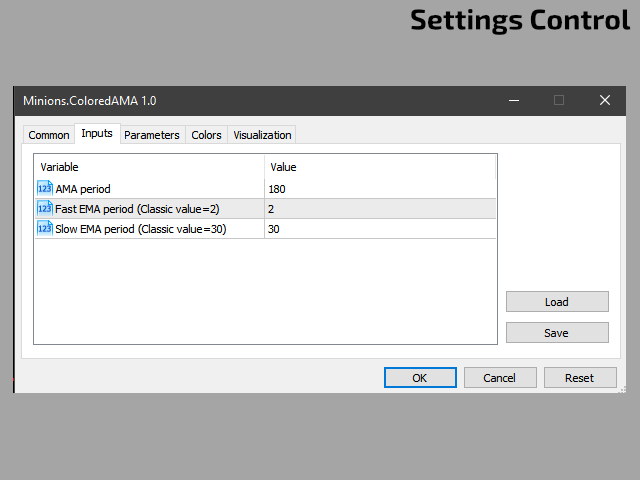
EINSTELLUNGEN
- AMA-Zeitraum
- Schnelle EMA-Periode. Dies ist eine Glättungskonstante - Teil der AMA-Berechnung. Belassen Sie es am Anfang bei 2. Wenn Sie dann mehr Verhalten benötigen, können Sie mit dieser und der folgenden Eingabe spielen.
- Langsame EMA-Periode. Die zweite Glättungskonstante. Belassen Sie diesen Wert zu Beginn bei 30.
Wenn Ihnen dieser Indikator gefällt, bitte ich Sie nur um ein kleines Review (kein Kommentar, sondern ein REVIEW!)...
Das wird mir sehr viel bedeuten... Und auf diese Weise kann ich weiterhin Cool Stuff for Free verschenken...
Ohne Bedingungen! Niemals!
Lebe lang und in Frieden!
;)


Extremely useful. I've combined another indicator with this indicator, and this will make me more profitable. I'm very grateful for this free indicator. THANK YOU VERY MUCH.