Market View Indicator
- Indikatoren
- Version: 1.1
- Aktualisiert: 29 November 2019
- Aktivierungen: 5

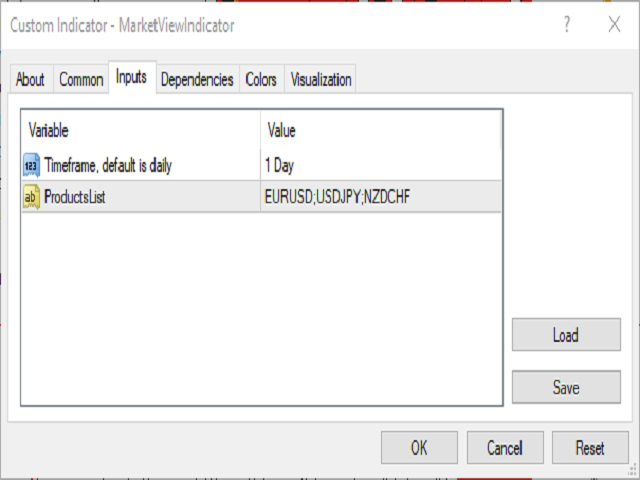
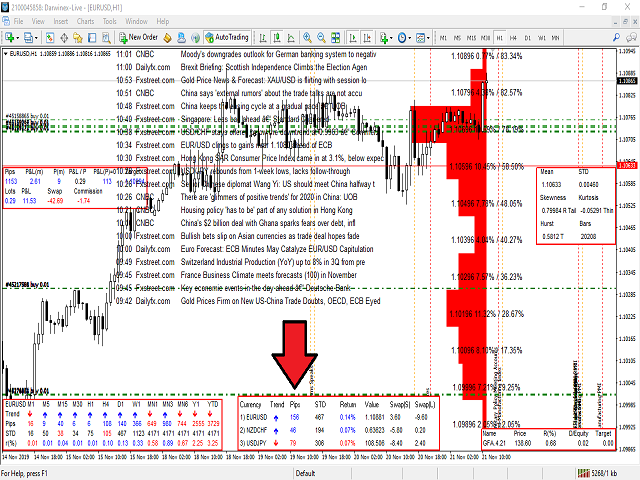
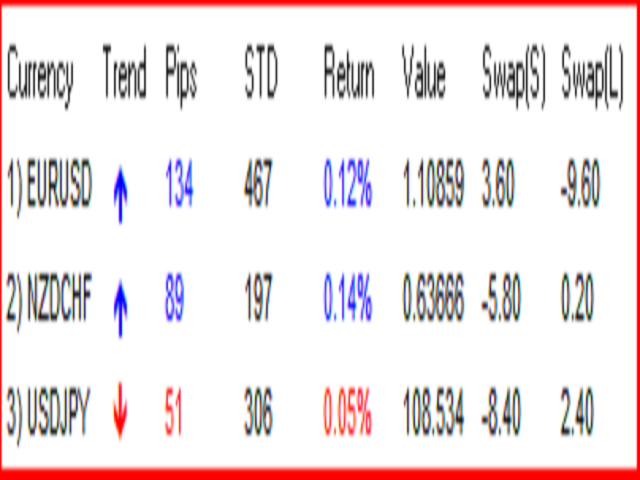
Mit dem Market View Indicator können Sie in einem eigenen Panel so viele Produkte überwachen, wie Sie möchten. Fügen Sie einfach den Indikator zum Chart hinzu, geben Sie die Produkte ein, die Sie sehen möchten, und den Zeitraum, in dem Sie die Veränderungen verfolgen möchten - das war's. Am unteren Rand des Charts öffnet sich ein Panel, das Ihnen für jedes Produkt die Veränderung in Pips, die Standardabweichung, die Rendite usw. anzeigt.
Ich persönlich verwende es, um mehrere Produkte zu verfolgen, bei denen ich Positionen habe, ohne mehrere Charts öffnen zu müssen, denn es spart mir Bandbreite und Zeit, zwischen den Bildschirmen zu wechseln. In diesem Beispiel habe ich Positionen in EURUSD, USDJPY und NZDCHF, also musste ich den Indikator nur einmal öffnen, diese Währungen mit der täglichen Veränderung als Überwachung hinzufügen und das war's.
© 2019 Roy Meshulam