Breakeven Calculator Indicator
- Indikatoren
- Version: 1.0
- Aktivierungen: 5

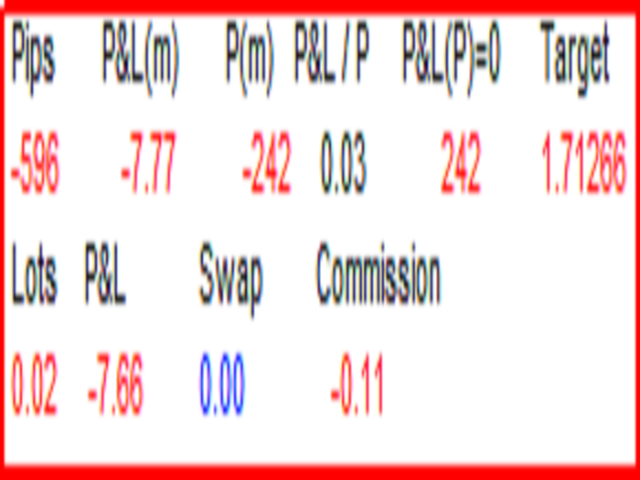
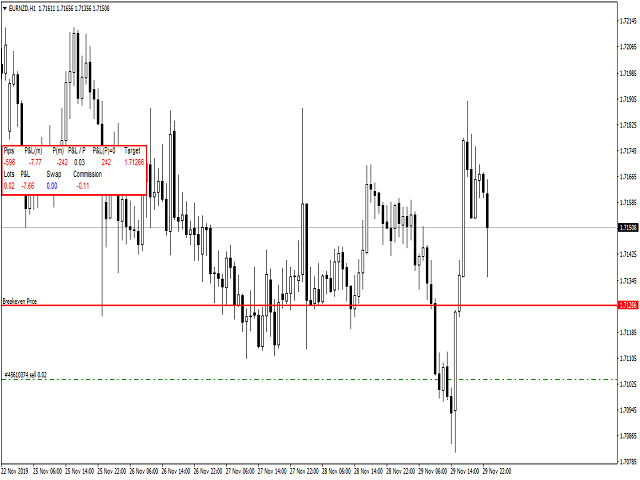
Breakeven Calcualtor ist ein Metatrader 4 Indikator, der den Breakeven-Wert für die offene P&L berechnet und anzeigt. Der Wert wird dynamisch auf der Grundlage von Marktbewegungen und -veränderungen aktualisiert. Wenn die Gesamt-GuV negativ ist, wird der Break-even-Punkt als roter Wert angezeigt, ansonsten als grüner Wert.
Neben dem Break-even-Wert werden auch die folgenden Werte angezeigt:
- Summe der Pips
- GuV-Änderung pro Minute
- Pips-Änderung pro Minute
- P&L gesamt
- Swap gesamt
- Kommissionen gesamt
© 2019 Roy Meshulam