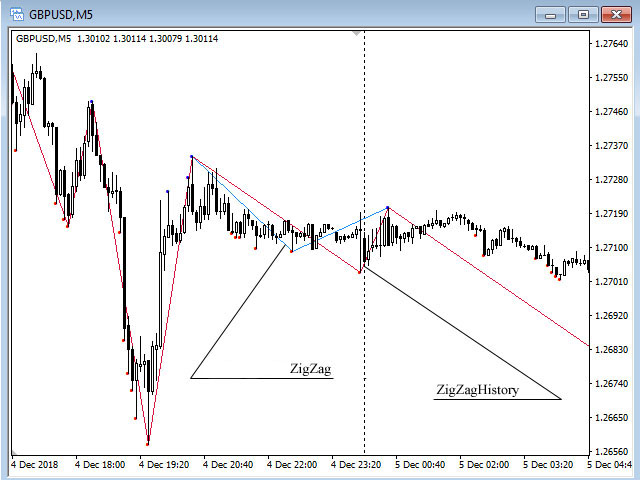
ZigZagHistory
- Indikatoren
- Version: 1.6
- Aktualisiert: 13 November 2019
- Aktivierungen: 9

Der Indikator wurde mit einem Ziel entwickelt - der angemessenen Verarbeitung von Geschichten und der maximalen Annäherung an das Original
(er war für die Entwicklung eines schwierigeren Indikators und die Verwendung im Experten erforderlich).
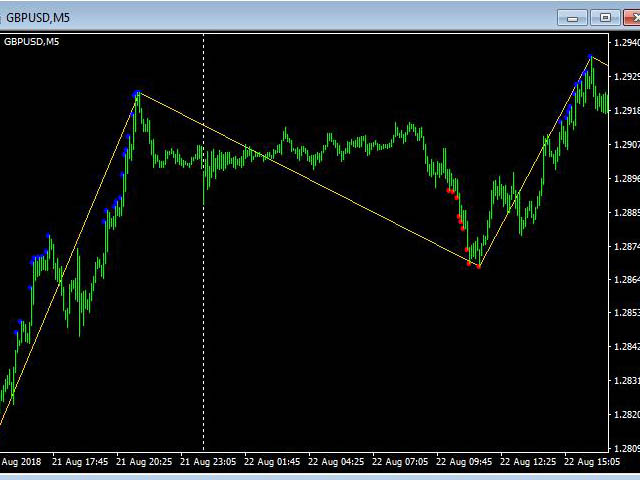
- geht nicht an Extrema vorbei (ein Beispiel auf dem 2. Screenshot).
Achtung: Der Parameter Preisrauschen hat einen erheblichen Einfluss auf die Bildung von Extrema.
Parameter:
Tiefe - ist die Tiefe der Suche nach einem lokalen Extremum in Balken;
Preisrauschen - ist der Standardwert des Preisrauschens für den aktuellen Zeitrahmen und das Tool;
Backstep - ist die Tiefe der Korrektur von globalen Extrema in Balken;
ShowHistory - schaltet die Anzeige der Historie ein/aus.
On minute calc - ist das Ein-/Ausschalten der Berechnung auf dem Minutenbalken (ausgeschaltet ist die Berechnung auf jedem Tick).