ZigZagHistory 2 TimeFrame
- Indikatoren
- Version: 1.6
- Aktualisiert: 13 November 2019
- Aktivierungen: 9

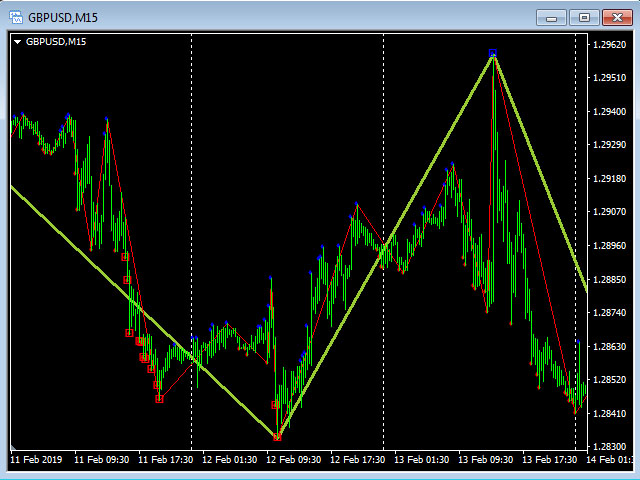
Die Farben und die Größe der Zeichen können angepasst werden.
Achtung: Der Parameter Preisrauschen hat einen erheblichen Einfluss auf die Bildung von Extrema.
HTF Depth ist die Tiefe der Suche nach einem lokalen Extremum in Bars auf dem hohen Timeframe;
HTF Preisrauschen - ist der Standardwert des Preisrauschens für den HTF und das Tool;
CTF Depth ist die Tiefe der Suche nach einem lokalen Extremum in Balken des aktuellen Zeitrahmens;
CTF Preisrauschen - ist der Standardwert des Preisrauschens für den aktuellen Zeitrahmen und das Tool;
CTF Backstep ist die Tiefe der Korrektur von globalen Extremen in Balken des aktuellen Zeitrahmens;
ShowHistory - schaltet die Anzeige der Historie ein/aus;
On minute calc - schaltet die Berechnung auf dem Minutenbalken ein/aus (ausgeschaltet ist die Berechnung auf jedem Tick).