VWAPBands
- Indicadores
- Versión: 1.6
- Actualizado: 24 junio 2020
- Activaciones: 5

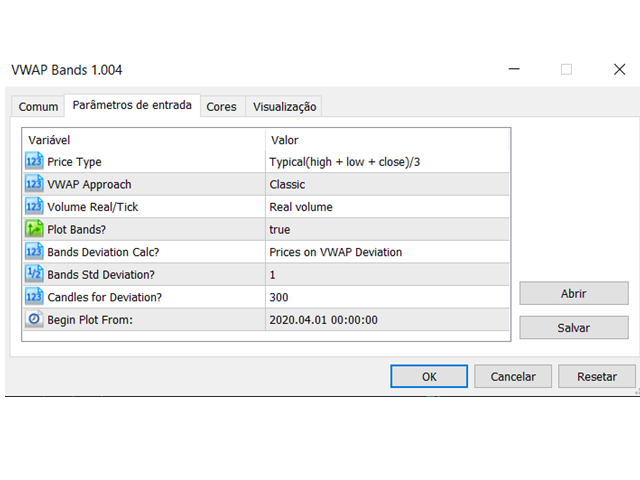
- Elija el símbolo y el tiempo gráfico deseado;
- Elija el tipo de precio más adecuado para calcular el VWAP deseado;
- Elija si desea o no que se grafiquen las Bandas;
- Elija el tipo de Volumen que desea utilizar (Ticks o Real);
- Elija el tipo de Cálculo de las Bandas (Desviación de Precios, Desviación de Precios en relación a VWAP, Desviación de VWAP Diario, Desviación de Precio en relación a VWAP de Dólar en base Tick Anualizado);
- Elija cuántas Desviaciones desea utilizar para trazar las Bandas;
- Elija cuántas velas desea calcular las desviaciones;
- Determina en el parámetro "Begin Plot" la fecha y hora de la vela BASE;
- Determina en el parámetro "MIDAS" el método VWAP;
- Determina el tipo de precios como ALTO para Midas Superior, BAJO para Midas Inferior;
- Bien, ya tienes el Soporte / Resistencia por el método MIDAS. Utilice las Bandas para tener mejores regiones.
Finalmente, también puede obtener el VWAP de la barra de VOLUMEN ALTO más reciente, del periodo seleccionado en el campo "Begin Plot":
- Determine en el parámetro "Begin Plot" la fecha de inicio de la vela de mayor volumen;
- Determine en el parámetro "Aproximación VWAP" la barra de mayor volumen;
- Otros parámetros a gusto del usuario;
- El Plot será a partir de la vela de mayor volumen más reciente, cualquier pasada anterior será ignorada.
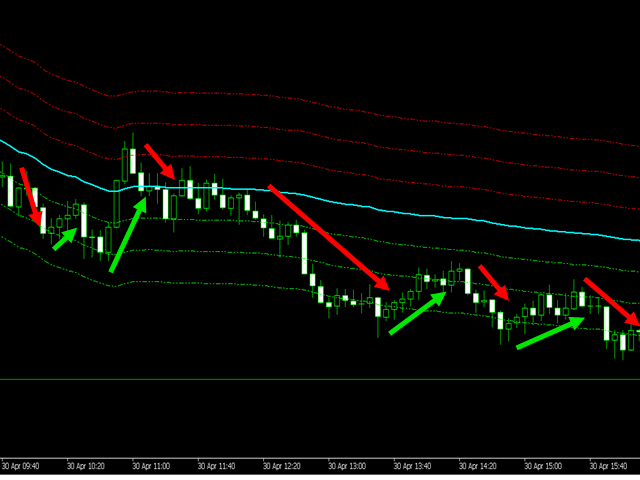
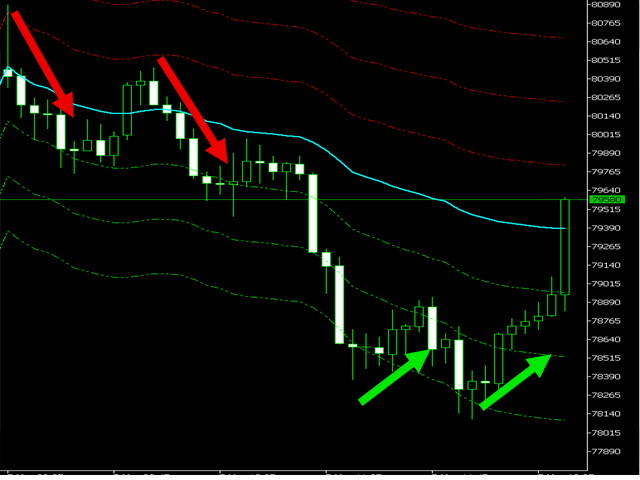
VWAP es la abreviatura de Volume Weighted Average Price. Por lo tanto, es un promedio de los precios negociados en un período determinado, ponderado por el volumen negociado en estos precios, sirviendo para muchos como un nivel de "lucha" porque los jugadores que hicieron este precio medio no tienen ningún interés en "perder" su precio medio . Las bandas son los puntos que podemos considerar para entrar y salir de las operaciones, según su funcionamiento, sirviendo también como soportes/resistencias de los precios.
¡Este indicador INCLUYE los datos actuales de las velas, lo que significa que siempre obtendrá los valores más recientes!