• Übersicht
  • Bewertungen (2)
  • Diskussion (5)
  • Neue Funktionen

Strategy Builder

5

Strategy Builder


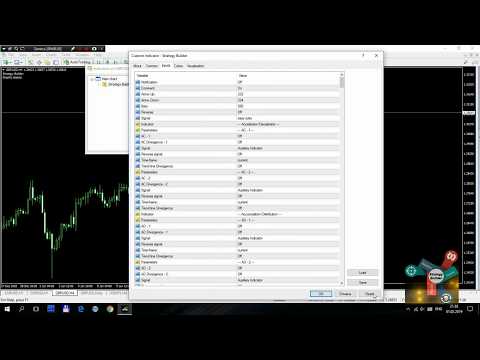
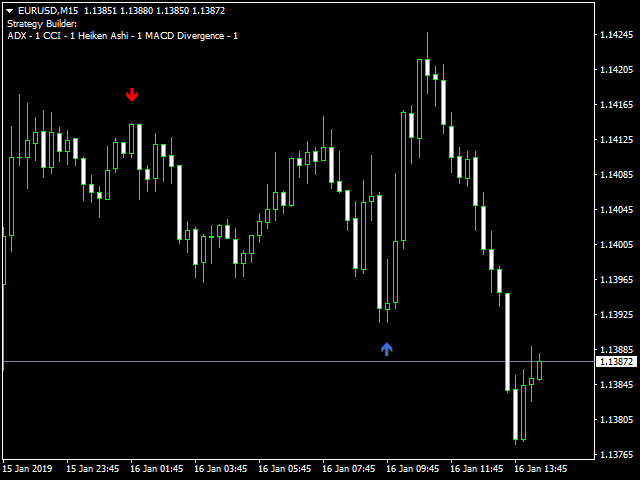
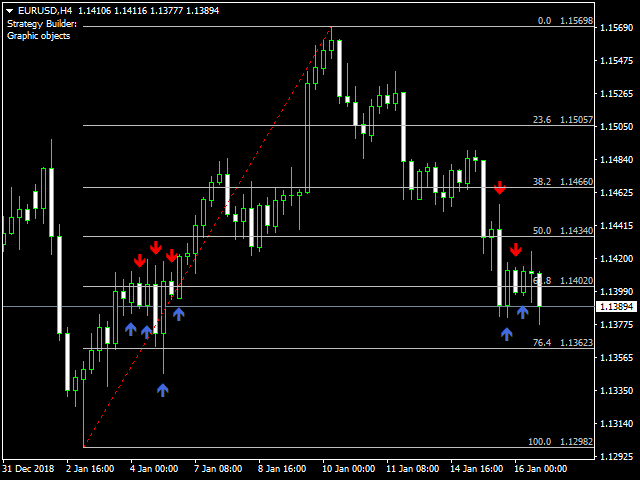
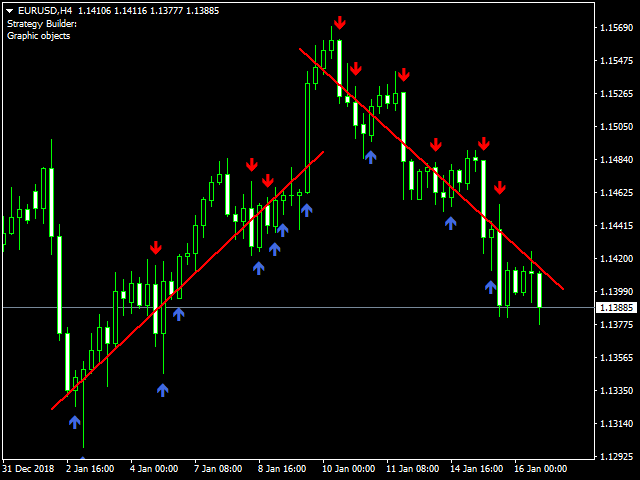
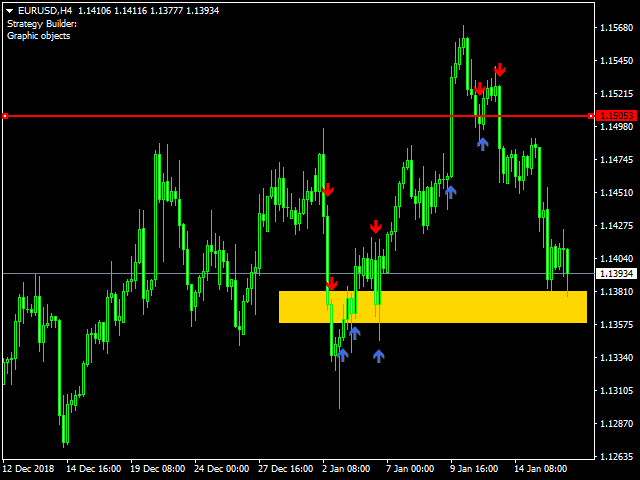
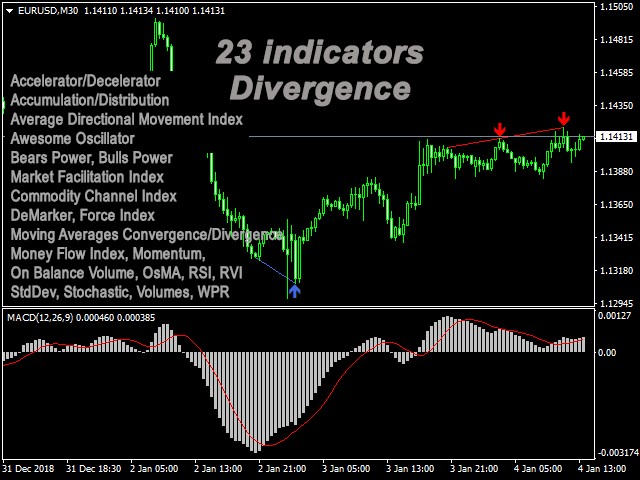
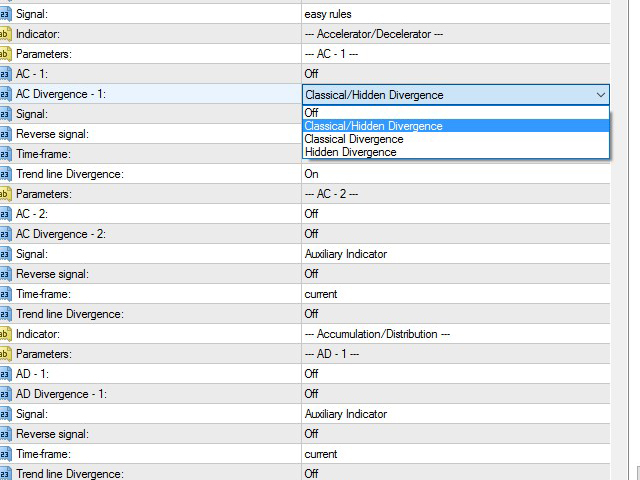
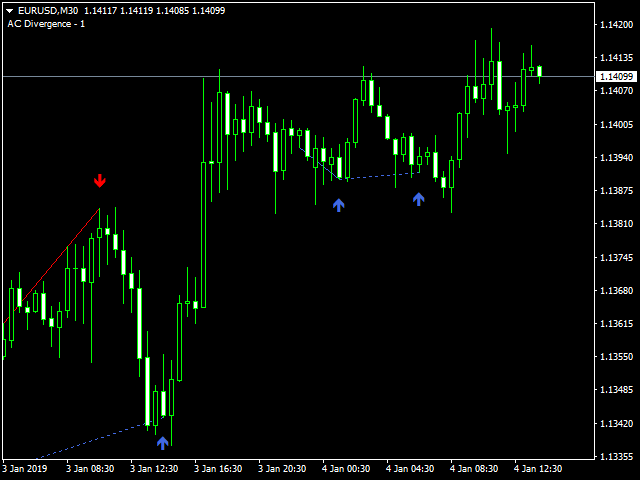
Mit dem Strategy Builder-Indikator können Sie klassische und individuelle Strategien erstellen, ohne das Diagramm mit einer großen Anzahl von Indikatoren zu laden und ohne viele verschiedene Indikatoren zu verfolgen, um das wahre Signal zu identifizieren. Strategy Builder zeigt Signale in Form von Pfeilen auf 30 Standardindikatoren an, 23 Indikatoren zeigen klassische und versteckte Divergenz, Empfangen von Signalen von Fibonacci-Levels, horizontal, Trendlinien und Rechteck. Mit Hilfe dieses Indikators können Sie Signale von einem Indikator sowie von mehreren Indikatoren empfangen, indem Sie in den Einstellungen die Haupt- und Hilfsindikatoren als Filter auswählen. 


Indikatortyp: Trend, Oszillatoren, Kanäle, Pegel, Multi-Zeitrahmen, Volumen.


Die Indikatoren sind dupliziert, so dass es möglich ist, die Messwerte zu erhalten, zum Beispiel RSI aus verschiedenen Zeitrahmen, es ist möglich, Signale zu empfangen, wenn die Linien (Kreuzung) auf 13 Indikatoren überquert werden.

Indikator:

  • AC - Accelerator/Decelerator + Divergence
  • AD - Accumulation/Distribution + Divergence
  • ADX - Average Directional Movement Index + Divergence
  • Alligator
  • AO - Awesome Oscillator + Divergence
  • ATR - Average True Range + Divergence + Crossing
  • Bands - Bollinger Bands® 
  • Bears Power + Divergence
  • Bulls Power + Divergence
  • BWMFI - Market Facilitation Index - Divergence
  • CCI - Commodity Channel Index + Divergence + Crossing
  • DeMarker + Divergence + Crossing
  • Envelopes + Crossing
  • Force Index + Divergence + Crossing
  • Fractals
  • Gator Divergence
  • Heiken Ashi
  • Ichimoku - Ichimoku Kinko Hyo
  • MA - Moving Average + Crossing
  • MACD - Moving Averages Convergence/Divergence + Divergence
  • MFI - Money Flow Index + Divergence + Crossing
  • Momentum + Divergence + Crossing
  • OBV - On Balance Volume + Divergence
  • OsMA - Moving Average of Oscillator + Divergence
  • RSI - Relative Strength Index + Divergence + Crossing
  • RVI - Relative Vigor Index + Divergence + Crossing
  • SAR - Parabolic Stop and Reverse system
  • StdDev - Standard Deviation + Divergence + Crossing
  • Stochastic Oscillator + Divergence + Crossing
  • Volumes + Divergence
  • WPR - Larry Williams' Percent Range + Divergence + Crossing
  • ZigZag
  • Graphic objects (horizontal, trend lines, rectangle, Fibonacci levels)

Rahmenbedingungen:

  • Notification  - Benachrichtigungen aktivieren
  • Comment  - um einen Kommentar zu den enthaltenen Indikatoren anzuzeigen
  • Arrow Up - Schriftzeichen Wingdings für Signal-up
  • Arrow Down - Schriftzeichen Wingdings für Signal nach unten
  • Bars - Die Anzahl der Balken im Verlauf, um die Signale des Indikators anzuzeigen
  • Reverse - Reverse-Signale von allen Indikatoren
  • Signal - Wählen Sie die Methode der Signalbildung, wenn mehrere Indikatoren verwendet werden: Strenge Regeln -Signale werden gebildet, wenn mehrere Indikatorsignale auf einem Balken zusammenfallen. einfache Regeln - Signale werden nach der Regel des Indikatorfilters und des Hauptindikators gebildet

Alle Parameter werden veröffentlicht in Diskussion.

Der Aufruf des Indikators in EA ist durch die Anzahl der iCustom-Eingabeparameter zum Empfangen von Signalen begrenzt: Der Indikator muss im Diagramm eingestellt sein, der Signalempfang ist mit der Funktion GlobalVariableGet möglich

ein Beispiel für eine Funktion zum Empfangen von Signalen in EA:

int IndicatorSignal(){
   if(GlobalVariableGet("Strategy Builder " + _Symbol + " " + (string)_Period) == 1.0) return 0; // sinal UP

   if(GlobalVariableGet("Strategy Builder " + _Symbol + " " + (string)_Period) == 2.0) return 1; // signal DOWN

   return -1;
}


Bewertungen 2
Dine Scalpers
51
Dine Scalpers 2019.02.07 21:48 
 

Amazing Service - I was having trouble setting it up and Pavel very quickly sent me 3 different "set" files to load into the indicator and it is doing what it's supposed to do. Definitely worth it.

UPDATE: Having a little concern at the moment since after testing this product much more intently. If you are okay with repainting programs, then this is for you. I am currently using it in the most basic of forms and just wanted to know when the Main Line crosses the Signal Line when above 80% or below 20% for a fast and medium setting in the same time frame. This is a definitive point in time when using a candle closed condition. However, after it shows this, it continues to move the "Suggestion" arrow as the chart "flat lines" and there is not much movement either way, removes the suggested trade arrow if it begins reversing on you, and then also moves the arrow down to the optimal point when it does finally go up in the direction originally shown.

In Conclusion, if you are sitting there at your charts, it typically will provide an alert at the correct time but, unfortunately it tries to make things look prettier than they really are by repainting to the perfect spot. I have put in a request to see if this failing feature of so many programs that can absolutely mess up a strategy can be deleted and based on that, we will look into adjust the star rating.

Dine

Empfohlene Produkte
VR Cub
Vladimir Pastushak
VR Cub ist ein Indikator für den Erhalt hochwertiger Einstiegspunkte. Der Indikator wurde entwickelt, um mathematische Berechnungen zu erleichtern und die Suche nach Einstiegspunkten in eine Position zu vereinfachen. Die Handelsstrategie, für die der Indikator geschrieben wurde, hat sich seit vielen Jahren bewährt. Ihr großer Vorteil liegt in der Einfachheit der Handelsstrategie, die es auch unerfahrenen Händlern ermöglicht, erfolgreich damit zu handeln. VR Cub berechnet Positionseröffnungspunkt
FIBO Trend PRO mt4
Evgenii Aksenov
5 (6)
The indicator allows you to instantly determine the current trend by color and FIBO levels. Higher Timeframe the panel shows the current trend of higher periods, helping to determine the strength of the trend Trade according to the trend when changing the color of candles or trade against the trend when the price hit the extreme levels of the   FIBO Trend PRO  indicator     Advantages of the FIBO Trend PRO Indicator never repaint and does not change their values Very easy to use and intuitive
Super Reversal Pattern
Parfait Mujinga Ndalika
Super Reversal Pattern Indicator Unlock the power of advanced pattern recognition with our Super Reversal Pattern Indicator. Designed for traders seeking precision and reliability, this indicator identifies one of the most effective reversal patterns in technical analysis, offering a significant edge in your trading strategy. Key Features: Non-Repainting Accuracy: Enjoy the confidence of non-repainting technology. Once a Super Reversal Pattern is detected, it remains static, providing consis
Indicator for binary options arrow is easy to use and does not require configuration works on all currency pairs, cryptocurrencies buy signal blue up arrow sell signal red down arrow tips do not trade during news and 15-30 minutes before their release, as the market is too volatile and there is a lot of noise it is worth entering trades one or two candles from the current period (recommended for 1 candle) timeframe up to m 15 recommended money management fixed lot or fixed percentage of the depo
SystemBinaryM1
Andrey Spiridonov
SystemBinaryM1 - a professional indicator for trading short-term binary options, is a complete, self-contained author's strategy for working in the binary options market. The unique algorithm for analyzing the foreign exchange market is based on the calculation of reference points on three different time periods M15, M5. M1. Thus, the indicator simultaneously analyzes the long-term, medium-term and short-term price behavior before issuing a signal. The indicator is set in the usual way and work
Binary Options Support Resistance Indicator This indicator is designed for binary options trading and effectively shows retracements from support and resistance levels. Signals appear on the current candle. A red arrow pointing downwards indicates a potential selling opportunity, while a blue arrow pointing upwards suggests buying opportunities. All that needs adjustment is the color of the signal arrows. It is recommended to use it on the M1-M5 timeframes as signals are frequent on these timef
Angry
Maryna Shulzhenko
Angry is a trend indicator, it indicates well the points of the beginning of the trend and its completion or reversal. This tool scans the market looking for the correct entry. Against the background of insignificant fluctuations, it is possible to identify a trend and indicate its direction. It uses only price data and analytics to calculate entry points. Does not use auxiliary indicators. Angry captures moments of stable price movement direction. There are only three types of trend: Bullish
Indikator. "Indikatorwelle oder Indikator Ma". Unter Verwendung von 23 Standardindikatoren und dem Algorithmus des Autors werden die Einkäufe (von 0 bis +100) und die Verkäufe (von 0 bis -100) berechnet. Dann zeichnet der "Wave Indicator" mit den berechneten Levels eine Welle mit 21 gleitenden Durchschnitten. Die Wellenzahl entspricht der Mittelungsperiode der berechneten Pegel. Wellen Nr. 1 - 7 sich schnell bewegende Durchschnitte Wellen von Nr. 8 bis 14 gleitender Durchschnitte Well
"Scalping-Handelsstrategie" - Der Indikator wurde für den Handel mit dem Scalping-System erstellt. "Scalping-Handelsstrategie" zeigt auf dem Chart mit einem Pfeil an, wohin der Preis jetzt gehen wird. Nachdem der Indikator einen Pfeil gezeichnet hat, bewegt sich der Preis um mindestens 20 Punkte in Pfeilrichtung. Dies ist genug für uns, um effektiv zu handeln. "Scalping-Handelsstrategie" zeichnet seine Signale nicht neu. Der Indikator hat viele verschiedene Betriebsmodi. Es kann einen Pfeil sow
Daily Candle Predictor ist ein Indikator, der den Schlusskurs einer Kerze vorhersagt. Der Indikator ist in erster Linie für die Verwendung in D1-Charts gedacht. Dieser Indikator eignet sich sowohl für den traditionellen Devisenhandel als auch für den Handel mit binären Optionen. Der Indikator kann als eigenständiges Handelssystem oder als Ergänzung zu Ihrem bestehenden Handelssystem verwendet werden. Dieser Indikator analysiert die aktuelle Kerze und berechnet bestimmte Stärkefaktoren innerhalb
TrendCompass is a powerful indicator for trading in the currency and cryptocurrency markets on the MetaTrader 4 platform. This innovative tool is designed to simplify analysis and decision-making in trading. The indicator combines various technical indicators and algorithms to provide accurate and timely trading signals. Key Features: Multilevel Strategy: TrendCompass is based on a comprehensive strategy that includes analyzing major trends, support and resistance levels, and various technical
Stochastic BR
Antony Augustine
Stochastic BR allows you to recognize reversals professionally. The "Stochastic BR" is designed to recognize profitable counter trend patterns from your chart. Stochastic Indicator: This technical indicator was developed by George Lane more than 50 years ago. The reason why this indicator survived for so many years is because it continues to show consistent signals even in these current times. The Stochastic indicator is a momentum indicator that shows you how strong or weak the current trend
This indicator displays the ZigZag Pointer Fibonacci Expansion Triangle movements timeframes only M1-W1. Parameters InDepth: Displays the Depth movements. InDeviation: Displays the Deviation movements. InBackstep: Displays the Backstep movements. Fibonacci Expansion: Displays the Fibonacci Expansion movements. Fibonacci Expansion true.(false) Triangle: Displays the Triangle movements. Triangle true.(false) How to understand the status: If the Triangle is green, trend is up. If the Triangle is
Strong Retracement Points Pro demo edition! SRP (Strong Retracement/Reversal Points) is a powerful and unique support and resistance indicator. It displays the closest important levels which we expect the price retracement/reversal! If all level are broken from one side, it recalculates and draws new support and resistance levels, so the levels might be valid for several days depending on the market! If you are still hesitating to start using this wonderful tool, you can check this link to see h
KT Horizontal Lines MT4
KEENBASE SOFTWARE SOLUTIONS
In MetaTrader, plotting multiple   horizontal lines   and then tracking their respective price levels can be a hassle. This indicator automatically plots multiple horizontal lines at equal intervals for setting price alerts, plotting support and resistance levels, and other manual purposes. This indicator is suitable for Forex traders who are new and looking for chances to make quick profits from buying and selling. Horizontal lines can help traders find possible areas to start trading when the
The Penta-O is a 6-point retracement harmonacci pattern which usually precedes big market movements. Penta-O patterns can expand and repaint quite a bit. To make things easier this indicator implements a twist: it waits for a donchian breakout in the right direction before signaling the trade. The end result is an otherwise repainting indicator with a very reliable trading signal. The donchian breakout period is entered as an input. [ Installation Guide | Update Guide | Troubleshooting | FAQ | A
This is a new strategy for SUPPLY DEMAND areas It is based on a calculation using the tick volume to detect the big price action in market for both bear /bull actions this smart volume action candles are used to determine the supply and demand areas prices in between main supply and demand lines indicate sideway market  up arrows will be shown when prices moves above the main supply and the secondary supply lines Down arrows will be shown when prices moves below the main demand and the secondary
Royal Dutch Skunk
Sayan Vandenhout
ROYAL DUTCH SKUNK USES THE TREND WAVE INDICATOR AND IT CAN IDENTIFY THE BEGINNING AND THE END OF A NEW WAVE TREND MOVEMENT. AS AN OSCILLATOR, THE INDICATOR IDENTIFIES THE OVERBOUGHT AND OVERSOLD ZONES. IT WORKS GREAT TO CATCH THE SHORT TERM PRICE REVERSALS AND USES A MARTINGALE STRATEGY TO CLOSE ALL TRADES IN PROFIT. USE DEFAULT SETTINGS ON H1 OR HIGHER TIME FRAME ON ANY PAIR FOR MORE ACCURATE TRADES WHY THIS EA : Smart entries calculated by 6 great strategies The EA can be run on even a $20000
Best indicator for trend reversals Can be optimized for crypto trading or all currency pairs How to use:When the arrow appears, wait for the candle to close and open the order Level lines appear when candle closes,  The system shows you the best entry levels It is simple and easy to use, no additional settings are required. Best indicator for beginners and professionals You can set the displayed stop loss and desired profit levels. You can use it alone or in addition to your strategy. Recommend
NO REPAINT ADVANCED CHART PATTERN INDICATOR By definition, a price ( chart)  pattern is a recognizable configuration of price movement that is identified using a series of  trendlines  and/or curves. When a price pattern signals a change in trend direction, it is known as a reversal pattern; a continuation pattern occurs when the trend continues in its existing direction following a brief pause. Advanced Chart Pattern Tracker is designed to find the MOST ACCURATE patterns. A special script is
SuperTrend Alerts
Libertas LLC
3 (4)
SuperTrend Alerts adds alerts to the widely popular SuperTrend indicator. As the name suggests, SuperTrend is a trending indicator which works best in trendy (not choppy) markets. SuperTrend is extremely popular for intraday and daily trading, and can be used on any timeframe. Place a call when the price closes above the SuperTrend line, and place a put when the price closes below the SuperTrend line. These crossovers are highlighted by non-repainting up/down arrows. Alerts Email, message and
To download MT5 version please click  here . This is the exact conversion from TradingView: "WaveTrend [LazyBear]" By "zeusuk3". One of the coolest indicators out there to detect overbought and oversold zones. It can be used as a part of more complicated strategy and for confirming a potential trade setup. There are buffers to use in EAs also. The indicator is loaded light and non-repaint. - You can message in private chat for further changes you need. Thanks for downloading 
Prozones Mt4
Renfred Dodzidenu Semabia
Discover Prozones Intraday MT4: Elevate Your Trading Success with Precision Are you tired of sifting through market noise in search of profitable trades? Look no further than Prozones Intraday MT4 – your ultimate solution for consistent trading success in the fast-paced world of intraday trading. Crafted with advanced algorithms and years of market expertise, this indicator empowers traders of all levels to make informed decisions with confidence. Key Features: Pinpoint Precision in Trend Analys
Master Scalping M1 ist ein innovativer Indikator, der einen Algorithmus verwendet, um den Trend schnell und genau zu bestimmen. Der Indikator berechnet den Zeitpunkt zum Öffnen und Schließen von Positionen, die Indikatoralgorithmen ermöglichen es Ihnen, die idealen Zeitpunkte für den Einstieg in einen Handel (Kauf oder Verkauf eines Vermögenswerts) zu finden, was den Erfolg von Transaktionen für die meisten Händler erhöht. Vorteile des Indikators: Einfach zu bedienen, überladen Sie das Diagramm
The principle of this indicator is very simple: detecting the trend with Moving Average, then monitoring the return point of graph by using the crossing of Stochastic Oscillator and finally predicting BUY and SELL signal with arrows, alerts and notifications. The parameters are fixed and automatically calculated on each time frame. Example: If you install indicator on EURUSD, timeframe M5: the indicator will detect the main trend with the Moving Average on this timeframe (for example the Moving
To get access to MT5 version please click   here . This is the exact conversion from TradingView: "Schaff Trend Cycle" by "everget". This is a light-load processing indicator. This is a non-repaint indicator. Buffers are available for processing in EAs. All input fields are available except fillings(due to MT4 graphical restrictions). You can message in private chat for further changes you need. Thanks for downloading
MACDivergence MTF
Pavel Zamoshnikov
4.29 (7)
Advanced ideas of the popular MACD indicator: It detects and displays classic and reverse divergences (three methods of detecting divergences). It uses different color to highlight an uptrend and a downtrend. Two methods of determining a trend: а) MACD crosses the 0 level (classic signal); б) MACD crosses its own average (early signal). This is a multi-timeframe indicator: it can display MACD data from other timeframes. Two methods of drawing: classic histogram and line. It generates sound and v
Cosmic Diviner X Planet
Olena Kondratenko
4 (2)
This unique multi-currency strategy simultaneously determines the strength of trends and market entry points, visualizing this using histograms on the chart. The indicator is optimally adapted for trading on the timeframes М5, М15, М30, Н1. For the convenience of users, the indicator renders the entry point (in the form of an arrow), recommended take profit levels (TP1, TP2 with text labels) and the recommended Stop Loss level. The take profit levels (TP1, TP2) are automatically calculated for
KT Renko Patterns MT4
KEENBASE SOFTWARE SOLUTIONS
2.33 (3)
KT Renko Patterns scans the Renko chart brick by brick to find some famous chart patterns that are frequently used by traders across the various financial markets. Compared to the time-based charts, patterns based trading is easier and more evident on Renko charts due to their uncluttered appearance. KT Renko Patterns features multiple Renko patterns, and many of these patterns are extensively explained in the book titled Profitable Trading with Renko Charts by Prashant Shah. A 100% automate
Gvs Undefeated Trend   indicator is designed for trend and signal trading. This indicator generates trend signals.  It uses many algorithms and indicators to generate this signal. It tries to generate a signal from the points with the highest trend potential. This indicator is a complete trading product. This indicator does not need any additional indicators.  You can only trade with this indicator. The generated signals are displayed on the graphical screen.  Thanks to the alert features you ca
Käufer dieses Produkts erwarben auch
Gann Made Easy
Oleg Rodin
4.85 (82)
Gann Made Easy ist ein professionelles und einfach zu bedienendes Forex-Handelssystem, das auf den besten Handelsprinzipien unter Verwendung der Theorie von Mr. basiert. W.D. Gann. Der Indikator liefert genaue KAUF- und VERKAUFSsignale, einschließlich Stop-Loss- und Take-Profit-Levels. Mit PUSH-Benachrichtigungen können Sie auch unterwegs handeln. Bitte kontaktieren Sie mich nach dem Kauf! Ich werde meine Handelstipps und tolle Bonusindikatoren kostenlos mit Ihnen teilen! Wahrscheinlich haben Si
TPSpro RFI Levels
Roman Podpora
4.82 (22)
ANWEISUNGEN    Russland -    ENG    Die Empfehlung basiert auf dem Indikator -   TPSpro   TREND PRO -   Version MT5 Die wichtigsten Elemente in der Branche sind entweder in Zonen oder in der Fabrik enthalten, oder sie führen zu einer Lösung bei einem Kauf oder dem Verkauf eines anderen Instruments. Wenn viele Menschen ihre Rechte nicht auf dem Händlerkonto verschlüsseln, werden die Folgen nicht schnell genug sein. Ich habe es damit abgeschlossen, dass ich diese Folgen nun noch interpretieren un
Gold Stuff
Vasiliy Strukov
4.89 (239)
Gold Stuff-Ein Trendindikator, der speziell für Gold entwickelt wurde, kann auch auf allen Finanzinstrumenten verwendet werden. Der Indikator wird nicht neu gezeichnet und verzögert sich nicht. Empfohlener Zeitrahmen H1. Nach diesem Indikator geschrieben EA Gold Stuff Berater, können Sie es in meinem Profil finden. WICHTIG! Kontaktieren Sie mich sofort nach dem Kauf, um Anweisungen und Bonus zu erhalten!   Sie können eine kostenlose Kopie unseres Strong Support- und Trendscanner-Indikators
Trend Punch
Mohamed Hassan
4.95 (19)
This indicator is unstoppable when combined with our other indicator called  Support & Resistance . After purchase, send us a message and you will get it   for  FREE as a BONUS! Introducing Trend Punch , the revolutionary forex trend indicator that will transform the way you trade! Trend Punch is uniquely designed to provide precise buy and sell arrows during strong market trends, making your trading decisions clearer and more confident. Whether you're trading major currency pairs or exotic sym
TPSproTREND PrO
Roman Podpora
4.79 (19)
TPSpro TREND PRO   ist ein Trendindikator, der den Markt automatisch analysiert und Informationen über den Trend und jede seiner Änderungen liefert sowie Signale für den Einstieg in Geschäfte ohne Neuzeichnung gibt! Der Indikator verwendet jede Kerze und analysiert sie separat. bezieht sich auf verschiedene Impulse – Aufwärts- oder Abwärtsimpuls. Exakte Einstiegspunkte in Transaktionen für Währungen, Krypto, Metalle, Aktien, Indizes! Version MT5                   VOLLSTÄNDIGE BESCHREIBUNG DES
Atomic Analyst
Issam Kassas
5 (2)
Zunächst einmal ist es erwähnenswert, dass dieser Handelsindikator nicht neu malt, nicht neu zeichnet und keine Verzögerung aufweist, was ihn sowohl für manuellen als auch für Roboterhandel ideal macht. Benutzerhandbuch: Einstellungen, Eingaben und Strategie. Der Atom-Analyst ist ein PA-Preisaktionsindikator, der die Stärke und das Momentum des Preises nutzt, um einen besseren Vorteil auf dem Markt zu finden. Ausgestattet mit fortschrittlichen Filtern, die helfen, Rauschen und falsche Signale z
FX Power MT4 NG
Daniel Stein
5 (12)
Erhalten Sie Ihr tägliches Marktupdate mit Details und Screenshots über unser Morning Briefing hier auf mql5 und auf Telegram ! FX Power MT4 NG ist die nächste Generation unseres langjährig sehr beliebten Währungsstärkemessers FX Power. Und was bietet dieser Stärkezähler der nächsten Generation? Alles, was Sie am ursprünglichen FX Power geliebt haben PLUS GOLD/XAU-Stärkeanalyse Noch präzisere Berechnungsergebnisse Individuell konfigurierbare Analysezeiträume Anpassbares Berechnungslimit für noc
Trend Screener
STE S.S.COMPANY
4.8 (87)
Trendindikator, bahnbrechende, einzigartige Lösung für Trendhandel und -filterung mit allen wichtigen Trendfunktionen in einem Tool! Es handelt sich um einen 100 % nicht neu zu malenden Multi-Timeframe- und Multi-Währungs-Indikator, der für alle Symbole/Instrumente verwendet werden kann: Forex, Rohstoffe, Kryptowährungen, Indizes und Aktien. ZEITLICH BEGRENZTES ANGEBOT: Der Support- und Resistance-Screener-Indikator ist für nur 50 $ und lebenslang verfügbar. (Ursprünglicher Preis 250 $) (Angebot
MetaBands M4
Vahidreza Heidar Gholami
5 (2)
MetaBands verwendet leistungsstarke und einzigartige Algorithmen, um Kanäle zu zeichnen und Trends zu erkennen, sodass es Tradern potenzielle Punkte für den Einstieg und Ausstieg aus Trades bieten kann. Es ist ein Kanalindikator sowie ein leistungsstarker Trendindikator. Es umfasst verschiedene Arten von Kanälen, die einfach durch Verwendung der Eingabeparameter zusammengeführt werden können. MetaBands verwendet alle Arten von Warnmeldungen, um Benutzer über Marktereignisse zu informieren. Funkt
- Real price is 80$ - 40% Discount ( It is 49$ now ) Contact me for instruction, add group and any questions! Related Product:  Bitcoin Expert Introduction The breakout and retest strategy is traded support and resistance levels. it involves price breaking through a previous level.  The break and retest strategy is designed to help traders do two main things, the first is to avoid false breakouts. Many false breakouts start with a candlestick that breaks out of a level but ends with an immediat
Dynamic Forex28 Navigator – Das Forex-Handelstool der nächsten Generation AKTUELL 49 % RABATT. Dynamic Forex28 Navigator ist die Weiterentwicklung unserer seit langem beliebten Indikatoren und vereint die Leistung von drei in einem: Advanced Currency Strength28 Indicator (695 Bewertungen) + Advanced Currency IMPULSE mit ALERT (520 Bewertungen) + CS28 Combo Signals (Bonus) Details zum Indikator https://www.mql5.com/en/blogs/post/758844 Was bietet der Strength Indicator der nächsten Generation?
Scalper Inside PRO
Alexey Minkov
4.73 (56)
An exclusive indicator that utilizes an innovative algorithm to swiftly and accurately determine the market trend. The indicator automatically calculates opening, closing, and profit levels, providing detailed trading statistics. With these features, you can choose the most appropriate trading instrument for the current market conditions. Additionally, you can easily integrate your own arrow indicators into Scalper Inside Pro to quickly evaluate their statistics and profitability. Scalper Inside
Enigmera
Ivan Stefanov
5 (3)
ENIGMERA: Der Kern des Marktes https://www.enigmera.com Einführung Dieser Indikator und dieses Handelssystem sind ein bemerkenswerter Ansatz für die Finanzmärkte. ENIGMERA nutzt die fraktalen Zyklen zur genauen Berechnung von Unterstützungs- und Widerstandsniveaus. Er zeigt die echte Akkumulationsphase an und gibt Richtung und Ziele vor.  Ein System, das funktioniert, egal ob wir uns in einem Trend oder in einer Korrektur befinden.  Wie funktioniert es? ENIGMERA besteht aus drei Linien: der
TrendMaestro
Stefano Frisetti
5 (3)
note: this indicator is for METATRADER4, if you want the version for METATRADER5 this is the link:  https://www.mql5.com/it/market/product/108106 TRENDMAESTRO ver 2.4 TRENDMAESTRO recognizes a new TREND in the bud, he never makes mistakes. The certainty of identifying a new TREND is priceless. DESCRIPTION TRENDMAESTRO identifies a new TREND in the bud, this indicator examines the volatility, volumes and momentum to identify the moment in which there is an explosion of one or more of these data a
DERZEIT 31% RABATT! Die beste Lösung für jeden Newbie oder Expert Trader! Dieser Indikator ist ein einzigartiges, qualitativ hochwertiges und erschwingliches Handelsinstrument, da wir eine Reihe von proprietären Funktionen und eine geheime Formel eingebaut haben. Mit nur EINEM Chart liefert er Alerts für alle 28 Währungspaare. Stellen Sie sich vor, wie sich Ihr Handel verbessern wird, weil Sie in der Lage sind, den genauen Auslösepunkt eines neuen Trends oder einer Scalping-Gelegenheit zu e
Derzeit 20% Rabatt! Die beste Lösung für jeden Neueinsteiger oder Expert Händler! Dieses Dashboard arbeitet mit 28 Währungspaaren. Es basiert auf 2 unserer Hauptindikatoren (Advanced Currency Strength 28 und Advanced Currency Impulse). Es bietet einen hervorragenden Überblick über den gesamten Forex-Markt. Es zeigt die Werte der Advanced Currency Strength, die Veränderungsrate der Währungen und die Signale für 28 Devisenpaare in allen (9) Zeitrahmen. Stellen Sie sich vor, wie sich Ihr Hande
FX Volume
Daniel Stein
4.58 (33)
Erhalten Sie Ihr tägliches Marktupdate mit Details und Screenshots über unser Morning Briefing hier auf mql5 und auf Telegram ! FX Volume ist der ERSTE und EINZIGE Volumenindikator, der einen ECHTEN Einblick in die Marktstimmung aus Sicht eines Brokers bietet. Es bietet fantastische Einblicke in die Positionierung von institutionellen Marktteilnehmern, wie z.B. Brokern, auf dem Forex-Markt, viel schneller als COT-Berichte. Diese Informationen direkt auf Ihrem Chart zu sehen, ist der wahre Game
Bomb Bank Signal
Igor Pereira Calil
5 (1)
Bombenbanksignal: Ihr Vertrauensindikator in MetaTrader 4 Bomb Bank Signal ist ein leistungsstarker Indikator für MetaTrader 4, der entwickelt wurde, um die relevantesten Trends auf dem Finanzmarkt zu identifizieren. Wenn Sie nach einem Tool suchen, das Bewegungen genau vorhersieht, ist die Bomb Bank der Verbündete, den Sie brauchen. So funktioniert es: Dieser Indikator kombiniert drei unterschiedliche Methoden – Volumenanalyse, Kerzenschließungen und symmetrischer Trend –, um Kauf- und V
Stratos Pali Indicator   is a revolutionary tool designed to enhance your trading strategy by accurately identifying market trends. This sophisticated indicator uses a unique algorithm to generate a complete histogram, which records when the trend is Long or Short. When a trend reversal occurs, an arrow appears, indicating the new direction of the trend. Important Information Revealed Leave a review and contact me via mql5 message to receive My Top 5 set files for Stratos Pali at no cost! D
Der Chart Patterns All-in-One Indikator hilft Tradern, verschiedene Chartmuster, die häufig in der technischen Analyse verwendet werden, zu visualisieren. Dieser Indikator unterstützt die Identifizierung möglicher Marktbewegungen, garantiert jedoch keine Rentabilität. Es wird empfohlen, den Indikator vor dem Kauf im Demomodus zu testen. Aktuelles Angebot : 50 % Rabatt auf den "Chart Patterns All in One" Indikator. Enthaltene Muster : Muster 1-2-3 : Erkennt Marktumkehrungen mithilfe von drei Schl
Supply and Demand Dashboard PRO
Bernhard Schweigert
4.8 (20)
Derzeit 20% reduziert! Dieses Dashboard ist eine sehr leistungsfähige Software, die mit mehreren Symbolen und bis zu 9 Zeitrahmen arbeitet. Es basiert auf unserem Hauptindikator (Beste Bewertungen: Advanced Supply Demand ).   Das Dashboard gibt einen guten Überblick. Es zeigt: Gefilterte Angebots- und Nachfragewerte einschließlich der Zonenstärkebewertung, Pips-Abstände zu/und innerhalb von Zonen, Es hebt verschachtelte Zonen hervor, Es gibt 4 Arten von Alarmen für die gewählten Symbole in
DERZEIT 26% RABATT Die beste Lösung für jeden Newbie oder Expert Trader! Dieser Indikator ist ein einzigartiges, qualitativ hochwertiges und erschwingliches Trading-Tool, da wir eine Reihe von proprietären Funktionen und eine neue Formel integriert haben. Mit nur EINEM Chart können Sie die Währungsstärke für 28 Forex-Paare ablesen! Stellen Sie sich vor, wie sich Ihr Handel verbessern wird, weil Sie in der Lage sind, den genauen Auslösungspunkt eines neuen Trends oder einer Scalping-Gelegenh
IX Power MT4
Daniel Stein
5 (5)
IX Power bringt die unschlagbare Präzision von FX Power endlich auch zu Nicht-Forex-Symbolen. Es bestimmt präzise die Intensität von kurz-, mittel- und langfristigen Trends in Ihren Lieblingsindizes, Aktien, Rohstoffen, ETFs und sogar Kryptowährungen. Sie können alles analysieren, was Ihr Terminal zu bieten hat. Probieren Sie es aus und erleben Sie, wie sich Ihr Timing beim Handel deutlich verbessert . IX Power Hauptmerkmale 100% präzise, nicht nachpinselnde Berechnungsergebnisse - für
Zunächst einmal ist es wichtig zu betonen, dass dieses Handelstool ein Nicht-Repaint-, Nicht-Redraw- und Nicht-Verzögerungsindikator ist, was es ideal für professionelles Trading macht. Online-Kurs, Benutzerhandbuch und Demo. Der Smart Price Action Concepts Indikator ist ein sehr leistungsstarkes Werkzeug sowohl für neue als auch erfahrene Händler. Er vereint mehr als 20 nützliche Indikatoren in einem und kombiniert fortgeschrittene Handelsideen wie die Analyse des Inner Circle Traders und Stra
Currency Strength Wizard ist ein sehr leistungsstarker Indikator, der Ihnen eine Komplettlösung für erfolgreichen Handel bietet. Der Indikator berechnet die Stärke dieses oder jenes Forex-Paares anhand der Daten aller Währungen in mehreren Zeitrahmen. Diese Daten werden in Form von benutzerfreundlichen Währungsindizes und Währungsstärkelinien dargestellt, anhand derer Sie die Stärke dieser oder jener Währung erkennen können. Sie müssen lediglich den Indikator an das Diagramm anhängen, mit dem Si
Entry Points Pro
Yury Orlov
4.62 (175)
Dies ist ein Indikator für MT4, der genaue Signale für den Einstieg in einen Handel ohne Repainting (Neuzeichnen) liefert. Er kann auf alle Finanzwerte angewendet werden: Forex, Kryptowährungen, Metalle, Aktien, Indizes. Er liefert ziemlich genaue Schätzungen und sagt Ihnen, wann es am besten ist, eine Position zu eröffnen und zu schließen. Sehen Sie sich das Video (6:22) mit einem Beispiel für die Verarbeitung nur eines Signals an, das sich für den Indikator gelohnt hat! Die meisten Händler ver
Trend Cutter
Oleg Rodin
5 (2)
Trend Cutter ist ein Trendindikator, der für jeden Zeitrahmen verwendet werden kann, einschließlich der niedrigeren Zeitrahmen wie M1 und M5. Der Indikator ist ideal für Händler, die den Intraday-Handel bevorzugen, und wird auch für diejenigen hilfreich sein, die den langfristigen Handel bevorzugen. Sie können diesen Indikator als Basis für Ihr Handelssystem oder als eigenständige Handelslösung verwenden. Der Indikator bietet alle Arten von Warnungen, einschließlich PUSH-Benachrichtigungen. Der
Werden Sie Breaker Trader und profitieren Sie von Änderungen der Marktstruktur, wenn sich der Preis umkehrt. Der Order Block Breaker Indikator zeigt an, wann sich eine Trend- oder Preisbewegung der Erschöpfung nähert und bereit ist, sich umzukehren. Es weist Sie auf Änderungen in der Marktstruktur hin, die normalerweise auftreten, wenn eine Umkehrung oder ein größerer Rückzug bevorsteht. Der Indikator verwendet eine proprietäre Berechnung, die Ausbrüche und Preisdynamik identifiziert. Jedes
Trend Pulse
Mohamed Hassan
5 (4)
Please contact me after purchase to immediately get your PDF strategy + documentation for Trend Pulse !  Introducing Trend Pulse , a unique and robust indicator capable of detecting bullish, bearish, and even ranging trends! Trend Pulse uses a special algorithm to filter out market noise with real precision. If the current symbol is moving sideways, Trend Pulse will send you a ranging signal, letting you know that it's not a good time to enter a trade. This excellent system makes Trend Pulse
PowerBall Signals ist ein KAUF-/VERKAUF-Signalindikator, der auf der Idee der Nutzung von Unterstützungs-/Widerstandszonen basiert. Der Indikator erkennt spezielle Umkehrmuster basierend auf Unterstützungs-/Widerstandszonen und stellt diese Signale auf Ihrem Chart bereit. Die Hauptidee des Indikators besteht darin, die MTF-Analyse (Multi Time Frame) zu verwenden und Signale basierend auf den Niveaus Ihres aktuellen und nächsthöheren Zeitrahmens bereitzustellen. Mit dieser Methode können mögliche
Weitere Produkte dieses Autors
OsMA Arrow MTF
Pavel Shutovskiy
4.25 (8)
The indicator displays crossing zero level by Moving Average of Oscillator (OsMA) in the form of arrows. The this is a multi-timeframe indicator, and it displays signals from other timeframes. The indicator notifies about a signal by means of a pop-up Alert window, or sending notification to e-mail. Parameters Time-frame - select timeframe to show indicator signals. Fast EMA Period - fast EMA. This is an exponential moving average from a price with a short period. Slow EMA Period - slow EMA. T
FREE
Beacon
Pavel Shutovskiy
5 (2)
The indicator determines overbought/oversold zones on various timeframes. Arrows show market trend in various time sessions: if the market leaves the overbought zone, the arrow will indicate an ascending trend (arrow up), if the market leaves the oversold zone, the arrow will indicate a descending trend (arrow down). Situation on the timeframe, where the indicator is located, is displayed in the lower right window. Information on the market location (overbought or oversold zone), as well as the
FREE
OsMA Arrow
Pavel Shutovskiy
4.4 (5)
The indicator displays crossing zero level by Moving Average of Oscillator (OsMA) in the form of arrows. The indicator notifies about a signal by means of a pop-up Alert window, or sending notification to e-mail. Parameters Fast EMA Period - fast EMA. This is an exponential moving average from a price with a short period. Slow EMA Period - slow EMA. This is also an exponential moving average of a market price but with a longer period. Signal SMA Period - MACD SMA. This is a signal line which i
FREE
Maps
Pavel Shutovskiy
4.75 (4)
The indicator displays on the chart a map, on which markers show the current trading session, as well as shows a text. The indicator provides two types of background display: white and black. The indicator is displayed as the background and does not hinder tracking the current market situation. Parameters: GMT -  the time difference of the terminal and GMT. Background - selection of background - black or white.
FREE
AD Trend line
Pavel Shutovskiy
5 (1)
AD Trend line draws trend lines on the basis of A/D indicator (Accumulation/Distribution). When A/D indicator breaks a trend line, the probability of the trend reversal is very high. This is a multitimeframe indicator which can display values from higher timeframes. Parameters Time-frame — Select a timeframe; zero is the current timeframe of the chart; Trend Line — Display lines on the chart; Apply to — Apply lines to close the candle's highest/lowest value; Width line — Width of the line; Style
FREE
Trend following
Pavel Shutovskiy
4.5 (2)
The EA in the form of histogram displays up and down trends. This tool is recommended to be used as a filter. Its readings will help to detect beginning, end, and continuation of a trend. This additional tool will suit any trading system. Parameters Period — indicator period; Bars — number of bars on the history.
FREE
AC Arrow
Pavel Shutovskiy
4 (2)
The indicator displays zero level Accelerator Oscillator (AC) crossover in the form of dots on the chart. In indicator settings one can specify number of bars in the history to display signals, as well as shift of dots with respect to a bar. Parameters Bars — number of bars in the history to display indicator's signals; Shift — shift of dots with respect to bars.
FREE
MA 2 Histogram
Pavel Shutovskiy
4 (1)
The indicator is based on two Moving Averages. Its only difference from traditional indicators is that it is presented as a histogram. The histogram has four colors; each color represents a MA with its own period. In case of a descending trend, if a price is lower than a moving average, the indicator displays a value lower than the red zero level. In case of ascending trend, the indicator value is higher than the green zero level. Parameters: Period MA 1 - Period of the first moving average. MA
FREE
Fibo
Pavel Shutovskiy
5 (2)
The script sets Fibonacci levels on the chart using maximums and minimums visible on the chart. The script names Fibo with such timeframe on which it has been launched (Fibo D1 or Fibo M30, etc.), therefore preserving previously constructed levels on different time charts. This instrument will be useful for those who start studying Fibonacci levels and those who need to form these levels in a speedy fashion. The script does not have additional settings. Fibonacci lines can be amended in standard
FREE
Any chart has patterns of consolidation which are also called accumulation patterns. These are sections where the market has been on the same price level during significant amount of time, and thus it was accumulating positions. After such accumulation, positions are distributing, and the market passes from flat into trend. The Consolidation Levels indicator is a professional tool which identifies these sections and builds levels according to the price of the market at the moment of consolidatio
ATR Pivot
Pavel Shutovskiy
The indicator calculates the levels by ATR daily range using the equations: 1AR = Open + ATR -1AS = Open - ATR AR 1/2 = Open + (ATR / 2) AS -1/2 = Open - (ATR / 2) AR 1/4 = Open + (ATR / 4) AS -1/4 = Open - (ATR / 4) AR 3/4 = Open + ((ATR*3) / 4) AS -3/4 = Open - ((ATR*3) / 4) AR 2 = Open + (ATR*2) AS -2 = Open - (ATR*2) Parameters Period ATR - ATR period Shift time - shift by time for Open Color opening of day - Open line color Color 1AR, -1AS - 1AR, -1AS line color Color AR 1/2, AS -1/2 - A
Max Min Levels
Pavel Shutovskiy
The indicator makes levels according to local maximums and minimums of a week, a month, or a year. Parameters: Week number - number of weeks for lines display Week level color - Week line color Month number - number of months for lines display Month level color - Month line color Year number - number of years for lines display Year level color - Year line color Width line - Width of lines Style line - Style of lines
AO AC Signal
Pavel Shutovskiy
The indicator displays signals of different indicators (which can be selected in parameters) on a chart when zero level is crossed. AO, AC or AO+AC if signals of two indicators coincide. The indicator shows an Alert message (pop-up window) when a signal appears. Parameters: Indicators - Selection of the indicator AO, AC, AO+AC. Bars - Number of bars in history for display of signals. Alert - Pop-up window in case of a signal.
The indicator displays trend reversal in the form of arrows. The indicator does not change its values (is not redrawn) after a signal. The program notifies about arrows by means of a pop-up window, or sending notification to e-mail. This is a multitimeframe instrument. Values of the indicator may be displayed from higher timeframes. Parameters Time-frame - select time session; zero is the current timeframe (Time-frame cannot be lower than the current time interval). Bars - number of bars on th
Beginning
Pavel Shutovskiy
The indicator builds levels from beginning of a week or a month, or according to local Highs and Lows. These levels are meant for detection of strong support and resistance levels on a chart. Most big players of the market are guided by particularly these data: opening of the week or opening of the month. Breakout of one or several Highs and price consolidation on these levels suggest that market intends to grow. Breakout of Lows and price consolidation bears evidence of market's intention to mo
F trend
Pavel Shutovskiy
The indicator is designed for scalping fans, it gives signals of an average of ten pips. The indicator is based on mathematical calculation, it determines the average range of the price channel, which is generally formed at the time of accumulation of positions. Once the price moves beyond its borders, a signal is generated in the form of an arrow. The indicator has a minimum of settings: the period for which you need to calculate, and the frequency of signals (the signal frequency is determined
ADX arrow
Pavel Shutovskiy
5 (1)
ADX arrow Dieser Indikator zeigt die Signale des ADX-Indikators (Average Directional Movement Index) als Punkte auf dem Chart an. Dies erleichtert die visuelle Identifizierung von Signalen. Der Indikator verfügt auch über Warnungen (Pop-up-Meldungsfelder) Push-und Senden von Signalen an E-Mail. Rahmenbedingungen Zeitraum   - Mittelungszeitraum. Anwenden auf   - Preis für Berechnungen verwendet: Schließen, Öffnen, Hoch, Niedrig, Median (hoch + niedrig) / 2, Typisch (hoch + niedrig + sc
Woltec
Pavel Shutovskiy
4 (1)
The indicator has been developed for scalping. The indicator is based on a mathematical calculation that determines the percent range of the price channel, which is generally formed at the time of the accumulation of positions. Once the price moves beyond its borders, a signal is generated in the form of dots. The indicator has a minimum of settings - the frequency of signals. Smaller values produce more signals. Parameters: Multiplier - the frequency of signals (with lower values signals are
Jaguar tac
Pavel Shutovskiy
The indicator uses the Envelopes channel in its calculations, which allows working with dynamic support and resistance levels. It also considers the direction and strength of the trend, as well as the mathematical calculation that determines the percent range of the price channel, which is generally formed at the time of the accumulation of positions. It first generates a preliminary signal in the form of a round arrow. Then it is necessary to wait for a normal arrow and enter the market only af
ADX trend
Pavel Shutovskiy
This indicator displays the signals of the ADX indicator (Average Directional Movement Index) as points on the chart. This facilitates the visual identification of signals. The indicator also features alerts (pop-up message boxes) and sending signals to e-mail. Parameters Period - averaging period. Apply to - price used for calculations: Close, Open, High, Low, Median (high+low)/2, Typical (high+low+close)/3, Weighted Close (high+low+close+close)/4. Alert - enable/disable alerts. EMail - enabl
ADX arrow N
Pavel Shutovskiy
ADX arrow Dieser Indikator zeigt die Signale des ADX-Indikators (Average Directional Movement Index) als Punkte auf dem Chart an. Dies erleichtert die visuelle Identifizierung von Signalen. Der Indikator verfügt auch über Warnungen (Pop-up-Meldungsfelder) Push-und Senden von Signalen an E-Mail. Rahmenbedingungen Zeitraum - Mittelungszeitraum. Anwenden auf - Preis für Berechnungen verwendet: Schließen, Öffnen, Hoch, Niedrig, Median (hoch + niedrig) / 2, Typisch (hoch + niedrig + schlie
ATR Pivots
Pavel Shutovskiy
The indicator calculates intraday levels based on the average daily price range, builds support and resistance levels that may be reversal. Parameters Period ATR - period of the ATR indicator Shift time - time offset for the opening of the day Color opening of day - color of the opening line of the day Color 1AR, -1AS - line color 1AR, -1AS Color AR 1/2, AS -1/2 - line color AR 1/2, AS Color AR 1/4, AS -1/4 - line color AR 1/4, AS -1/4 Color AR 3/4, AS -3/4 - line color AR 3/4, AS -3/4 Colo
Auswahl:
Andrzej Swietochowski
133
Andrzej Swietochowski 2021.03.08 12:52 
 

It's wasted money. The signal keeps shifting. This program cannot be trusted. The program repaints its signals. Don't buy it - it's a waste of time and a waste of your money. I haven't seen anything worse. The seller should refund your money for this. You can't build a strategy because no one knows when the signal was in the past, and these past signals shown - are repainted, changed. He even repaints 1 indicator.

Dine Scalpers
51
Dine Scalpers 2019.02.07 21:48 
 

Amazing Service - I was having trouble setting it up and Pavel very quickly sent me 3 different "set" files to load into the indicator and it is doing what it's supposed to do. Definitely worth it.

UPDATE: Having a little concern at the moment since after testing this product much more intently. If you are okay with repainting programs, then this is for you. I am currently using it in the most basic of forms and just wanted to know when the Main Line crosses the Signal Line when above 80% or below 20% for a fast and medium setting in the same time frame. This is a definitive point in time when using a candle closed condition. However, after it shows this, it continues to move the "Suggestion" arrow as the chart "flat lines" and there is not much movement either way, removes the suggested trade arrow if it begins reversing on you, and then also moves the arrow down to the optimal point when it does finally go up in the direction originally shown.

In Conclusion, if you are sitting there at your charts, it typically will provide an alert at the correct time but, unfortunately it tries to make things look prettier than they really are by repainting to the perfect spot. I have put in a request to see if this failing feature of so many programs that can absolutely mess up a strategy can be deleted and based on that, we will look into adjust the star rating.

Dine

Antwort auf eine Rezension
Version 3.5 2020.05.27
Fixed receiving signals from the RVI indicator
Version 3.4 2020.02.16
Улучшение в расчетах функции Volumes
Version 3.3 2019.03.20
Исправлены сигналы в индикаторах осцилляторах
Version 2.0 2019.02.09
Добавлена возможность изменить язык уведомлений через файл Notification_SB.txt
Version 1.1 2019.02.03
Исправлена ошибка уведомлений