ATR Pivot
- Indikatoren
- Version: 1.10
- Aktualisiert: 24 August 2022
- Aktivierungen: 20

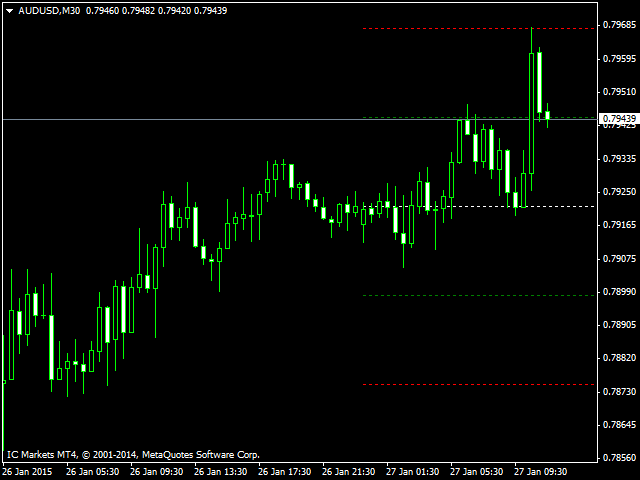
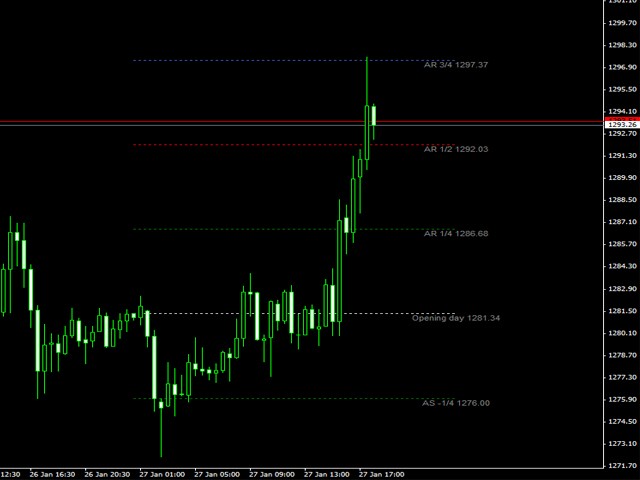
Der Indikator berechnet die Niveaus anhand der ATR-Tagesspanne unter Verwendung der folgenden Gleichungen:
- 1AR = Eröffnet + ATR
- -1AS = Eröffnet - ATR
- AR 1/2 = Eröffnet + (ATR / 2)
- AS -1/2 = Eröffnet - (ATR / 2)
- AR 1/4 = Offen + (ATR / 4)
- AS -1/4 = Offen - (ATR / 4)
- AR 3/4 = Offen + ((ATR*3) / 4)
- AS -3/4 = Offen - ((ATR*3) / 4)
- AR 2 = Offen + (ATR*2)
- AS -2 = Offen - (ATR*2)
Parameter
- Zeitraum ATR - ATR-Zeitraum
- Verschiebungszeit - Verschiebung um die Zeit für Open
- Farbe Eröffnung des Tages - Farbe der Open-Linie
- Farbe 1AR, -1AS - 1AR, -1AS Linienfarbe
- Farbe AR 1/2, AS -1/2 - AR 1/2, AS Linienfarbe
- Farbe AR 1/4, AS -1/4 - AR 1/4, AS -1/4 Linienfarbe
- Farbe AR 3/4, AS -3/4 - AR 3/4, AS -3/4 Strichfarbe
- Farbe AR 2, AS -2 - AR 2, AS -2 Strichfarbe
- Stil Linie - Linienstil
- Beschriftung - Anzeige der Zeilenbeschriftung
Der Benutzer hat keinen Kommentar hinterlassen