Woltec
- Indikatoren
- Version: 1.10
- Aktualisiert: 2 Februar 2022
- Aktivierungen: 20

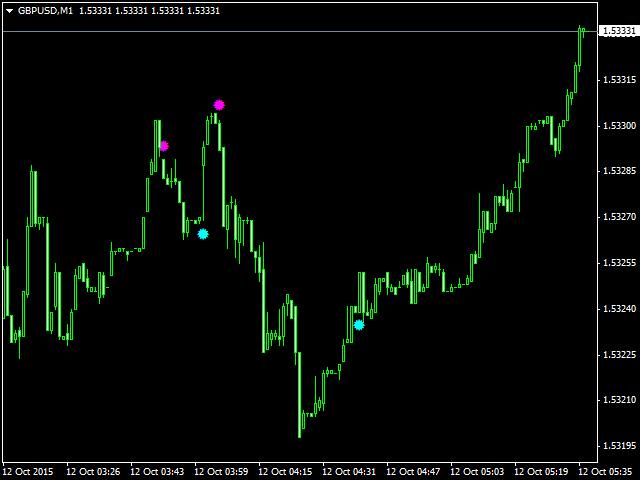
Der Indikator wurde für das Scalping entwickelt. Der Indikator basiert auf einer mathematischen Berechnung, die die prozentuale Spanne des Preiskanals bestimmt, die sich im Allgemeinen zum Zeitpunkt des Aufbaus von Positionen bildet. Sobald sich der Preis über seine Grenzen hinaus bewegt, wird ein Signal in Form von Punkten erzeugt. Der Indikator hat ein Minimum an Einstellungen - die Häufigkeit der Signale. Kleinere Werte erzeugen mehr Signale.
Parameter:
- Multiplikator - die Häufigkeit der Signale (bei niedrigeren Werten sind die Signale häufiger).
- Benachrichtigung - Art der Benachrichtigung: Popup-Alarm, E-Mail, Push.
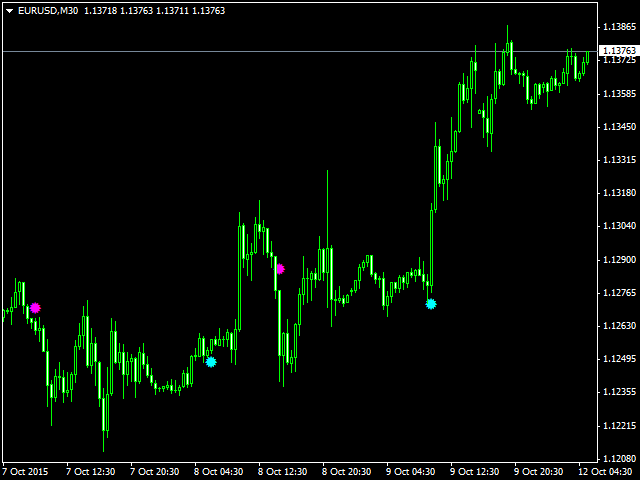
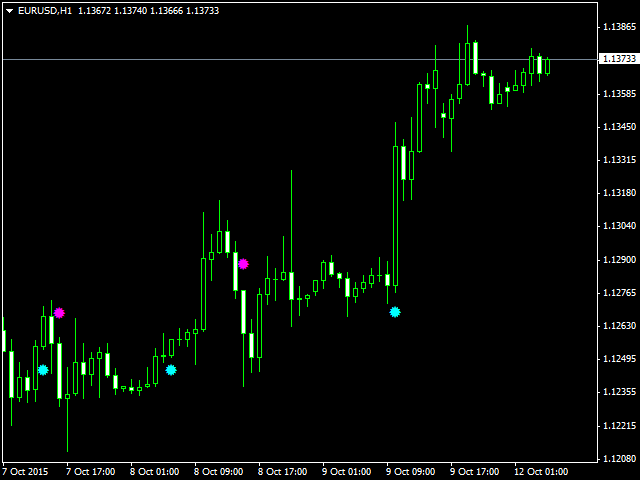
excellent results for M30 EUR/USD
Thanks sir..