Strategy Builder

5

Strategy Builder


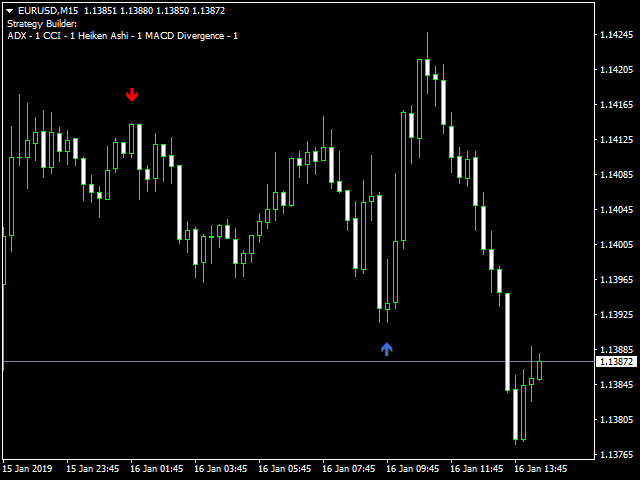
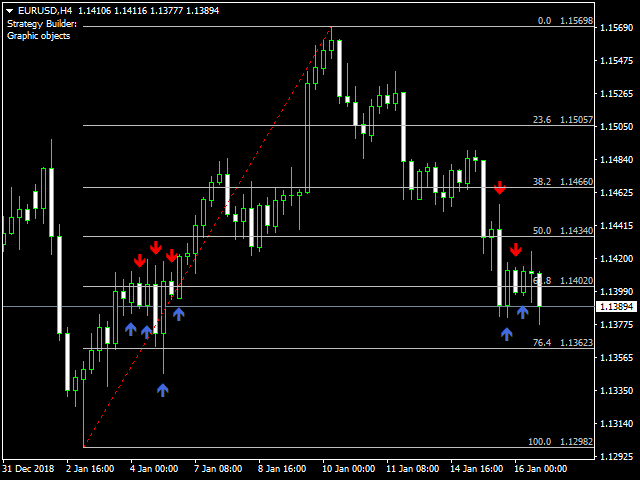
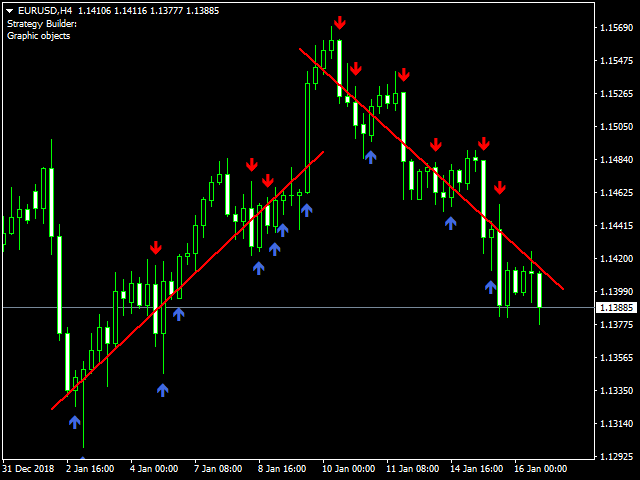
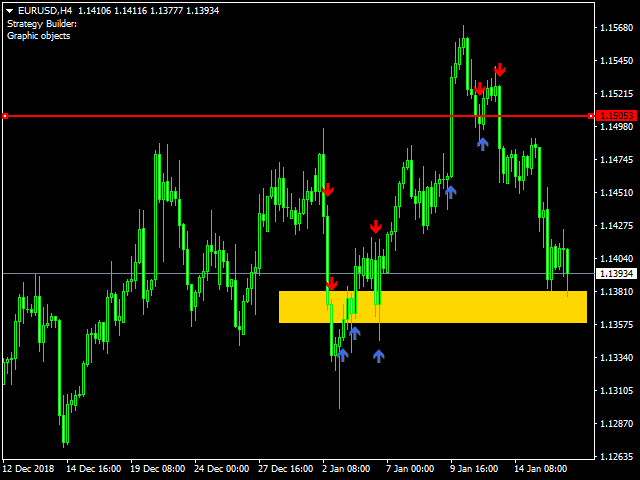
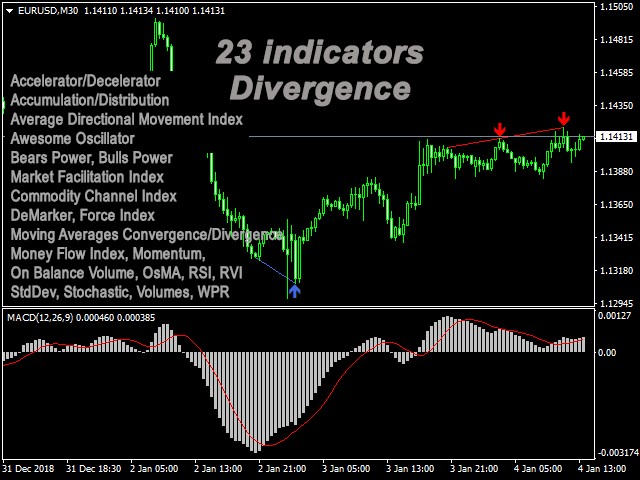
策略生成器指标允许您创建经典和个人策略,而无需使用大量指标加载图表,也无需跟踪许多不同的指标来识别真实信号。 Strategy Builder在30个标准指标上以箭头的形式显示信号,23个指标显示经典和隐藏分歧,接收来自斐波那契水平,水平,趋势线和矩形的信号。 借助此指标,您可以通过在设置中选择主要和辅助指标作为过滤器来接收来自一个指标以及来自多个指标的信号。


指标类型:趋势,振荡指标,通道,水平,多周期,交易量.


指标是重复的,因此可以获得读数,例如来自不同时间帧的RSI,可以在13指标上越过线(交叉)时接收信号。

指标:

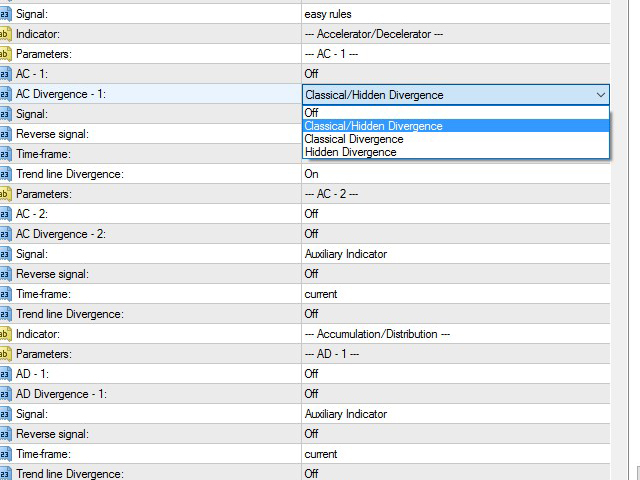
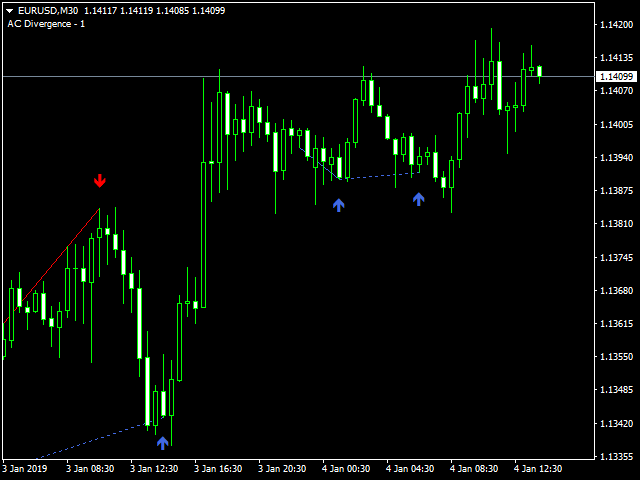
  • AC - Accelerator/Decelerator + Divergence
  • AD - Accumulation/Distribution + Divergence
  • ADX - Average Directional Movement Index + Divergence
  • Alligator
  • AO - Awesome Oscillator + Divergence
  • ATR - Average True Range + Divergence + Crossing
  • Bands - Bollinger Bands® 
  • Bears Power + Divergence
  • Bulls Power + Divergence
  • BWMFI - Market Facilitation Index - Divergence
  • CCI - Commodity Channel Index + Divergence + Crossing
  • DeMarker + Divergence + Crossing
  • Envelopes + Crossing
  • Force Index + Divergence + Crossing
  • Fractals
  • Gator Divergence
  • Heiken Ashi
  • Ichimoku - Ichimoku Kinko Hyo
  • MA - Moving Average + Crossing
  • MACD - Moving Averages Convergence/Divergence + Divergence
  • MFI - Money Flow Index + Divergence + Crossing
  • Momentum + Divergence + Crossing
  • OBV - On Balance Volume + Divergence
  • OsMA - Moving Average of Oscillator + Divergence
  • RSI - Relative Strength Index + Divergence + Crossing
  • RVI - Relative Vigor Index + Divergence + Crossing
  • SAR - Parabolic Stop and Reverse system
  • StdDev - Standard Deviation + Divergence + Crossing
  • Stochastic Oscillator + Divergence + Crossing
  • Volumes + Divergence
  • WPR - Larry Williams' Percent Range + Divergence + Crossing
  • ZigZag
  • Graphic objects (horizontal, trend lines, rectangle, Fibonacci levels)
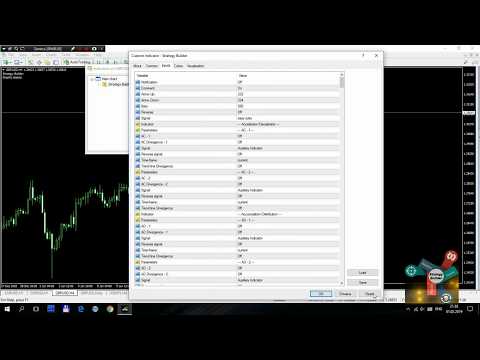
参数:

  • Notification -启用通知
  • Comment -显示有关所包含指标的注释
  • Arrow Up - 发出信号的字体字符
  • Arrow Down - 向下信号的字体字符
  • Bars - 历史中显示指示器信号的柱数
  • Reverse - 来自所有指标的反向信号
  • Signal - 当使用多个指标时,选择信号形成的方法:严格的规则-当多个指标信号在一个柱上重合时,将形成信号。 简单的规则-信号将根据指标过滤器和主要指标的规则形成

所有参数都在讨论中公布。

在EA中调用指标受iCustom输入参数数量的限制,以接收信号:指标必须在图表上设置,信号接收可以使用GlobalVariableGet函数

EA中接收信号的函数的一个例子:

int IndicatorSignal(){
   if(GlobalVariableGet("Strategy Builder " + _Symbol + " " + (string)_Period) == 1.0) return 0; // sinal UP

   if(GlobalVariableGet("Strategy Builder " + _Symbol + " " + (string)_Period) == 2.0) return 1; // signal DOWN

   return -1;
}


评分 2
Dine Scalpers
51
Dine Scalpers 2019.02.07 21:48 
 

Amazing Service - I was having trouble setting it up and Pavel very quickly sent me 3 different "set" files to load into the indicator and it is doing what it's supposed to do. Definitely worth it.

UPDATE: Having a little concern at the moment since after testing this product much more intently. If you are okay with repainting programs, then this is for you. I am currently using it in the most basic of forms and just wanted to know when the Main Line crosses the Signal Line when above 80% or below 20% for a fast and medium setting in the same time frame. This is a definitive point in time when using a candle closed condition. However, after it shows this, it continues to move the "Suggestion" arrow as the chart "flat lines" and there is not much movement either way, removes the suggested trade arrow if it begins reversing on you, and then also moves the arrow down to the optimal point when it does finally go up in the direction originally shown.

In Conclusion, if you are sitting there at your charts, it typically will provide an alert at the correct time but, unfortunately it tries to make things look prettier than they really are by repainting to the perfect spot. I have put in a request to see if this failing feature of so many programs that can absolutely mess up a strategy can be deleted and based on that, we will look into adjust the star rating.

Dine

推荐产品
PZ Mean Reversion MT4
PZ TRADING SLU
3 (4)
采用专业和量化方法进行均值回归交易的独特指标。它利用了价格以可预测和可衡量的方式转移并返回均值这一事实,这允许明确的进入和退出规则大大优于非量化交易策略。 [ Installation Guide | Update Guide | Troubleshooting | FAQ | All Products ] 清晰的交易信号 非常容易交易 可定制的颜色和尺寸 实现性能统计 优于大多数交易策略 显示合适的止损和止盈水平 它实现了电子邮件/声音/视觉警报 这个怎么运作 该指标从更高的时间范围测量完全可定制的移动平均线的标准偏差,并使用趋势跟踪方法精确地找到交易。交易是通过深入当前图表的价格行为发现的,并在价格返回到平均价格区间时关闭,根据您选择的更高时间范围计算。由于其编码方式,该指标将远离高波动性和强劲趋势市场,并且仅在可预测的情况下进行交易,在可接受的波动性与方向性比率范围内,回归均值是可行的。 指标剖析 绿线是更高时间范围内的移动平均线(也就是平均值) 虚线区域是移动平均线周围的典型价格区间 蓝线是看涨交易的突破价格 红线是看跌交易的突破价格 交易是针对均值进行的,并在典型的价格
“动态剥头皮震荡指标”是一款高级自定义加密货币外汇指标,适用于 MT4 平台,高效交易! - 新一代震荡指标 - 参见图片了解如何使用。 - 动态剥头皮震荡指标具有自适应超卖/超买区域。 - 震荡指标是一款辅助工具,可从动态超卖/超买区域找到准确的入场点。 - 超卖值:低于绿线,超买值:高于橙线。 - 该指标也非常适合与价格行为模式结合使用。 - 它比标准震荡指标更精准。适用时间范围:30 分钟、1 小时、4 小时、1 天、1 周。 - 提供 PC 和移动端警报。 ................................................................................................................. 点击这里查看高质量的交易机器人和指标! 本产品为原创,仅在 MQL5 网站上提供。
VR Cub
Vladimir Pastushak
VR Cub 这是获得高质量切入点的指标。该指标的开发是为了促进数学计算并简化对仓位入场点的搜索。多年来,该指标所针对的交易策略已被证明其有效性。交易策略的简单性是其巨大的优势,即使是新手交易者也能成功进行交易。 VR Cub 计算开仓点以及获利和止损目标水平,这显着提高了效率和易用性。查看使用以下策略进行交易的屏幕截图,了解简单的交易规则。 设置、设置文件、演示版本、说明、问题解决,可以从以下位置获取 [博客] 您可以在以下位置阅读或撰写评论 [关联] 版本为 [MetaTrader 5] 计算入场点的规则 开仓 要计算入场点,您需要将 VR Cub 工具从最后一个高点拉伸到最后一个低点。 如果第一个点在时间上早于第二个点,交易者等待柱线收于中线上方。 如果第一个点在时间上晚于第二个点,交易者等待柱线收于中线下方。 根据上述条件,严格在 柱线收盘 后建仓。 换句话说,如果我们在小时图上进行交易,那么从最高点到最低点的时间距离必须超过24小时,最高点和最低点之间的点数必须大于或等于平均价格变动每天。 维持和改变市场地位 可以有多个未平仓头寸;每个头寸都可以单独修改。 VR Cub
SMC Venom 模型 BPR 指標是針對在智慧貨幣 (SMC) 概念內工作的交易者的專業工具。它會自動辨識價格圖表上的兩種關鍵模式: FVG (公平價值缺口)是三根蠟燭的組合,其中第一根和第三根蠟燭之間存在缺口。它在水平之間形成一個沒有成交量支撐的區域,這通常會導致價格調整。 BPR (平衡價格區間)是兩種 FVG 模式的組合,形成一個「橋樑」 - 當價格以低成交量活動移動時,突破並返回到水平的區域,從而在蠟燭之間產生間隙。 這些模式可協助交易者透過分析圖表上的交易量和價格動態(大型市場參與者和普通參與者之間的互動)來識別關鍵的支撐/阻力位、突破區域和切入點。 此指標以矩形和箭頭的形式可視化模式,也支援靈活的警報設定。 主要特點: 模式顯示模式:選擇顯示 BPR 模式(看漲和看跌)或 FVG 模式(看漲和看跌)。 可以隱藏所有圖表分析模式。 以條數過濾:BPR 結構中 FVG 之間的最小/最大距離。 訊號的附加視覺化: 箭頭有 9 種類型可供選擇(標準、細、分形等)或手動輸入 Wingdings 代碼,其表格可以選擇性地顯示在圖表上。 使用 ATR 配置顏色、尺寸及其相對於價格
EARLY REMINDER: The Starting price is 65 price will rise soon up to 365$ and then 750$ after first 10 copies of sales. Grab this offer now! Introduction Hello, traders! Welcome to the demonstration of the Forex Beast Indicator , a comprehensive tool designed to assist aspiring traders in navigating the complexities of the forex market. This indicator incorporates seven essential components to provide a well-rounded trading experience: Moving Averages Colored Zones Support and Resistance Levels
Super Reversal Pattern
Parfait Mujinga Ndalika
Super Reversal Pattern Indicator Unlock the power of advanced pattern recognition with our Super Reversal Pattern Indicator. Designed for traders seeking precision and reliability, this indicator identifies one of the most effective reversal patterns in technical analysis, offering a significant edge in your trading strategy. Key Features: Non-Repainting Accuracy: Enjoy the confidence of non-repainting technology. Once a Super Reversal Pattern is detected, it remains static, providing consiste
Binary Option Signal
Yaroslav Varankin
Indicator for binary options arrow is easy to use and does not require configuration works on all currency pairs, cryptocurrencies buy signal blue up arrow sell signal red down arrow tips do not trade during news and 15-30 minutes before their release, as the market is too volatile and there is a lot of noise it is worth entering trades one or two candles from the current period (recommended for 1 candle) timeframe up to m 15 recommended money management fixed lot or fixed percentage of the depo
SystemBinaryM1
Andrey Spiridonov
SystemBinaryM1 - a professional indicator for trading short-term binary options, is a complete, self-contained author's strategy for working in the binary options market. The unique algorithm for analyzing the foreign exchange market is based on the calculation of reference points on three different time periods M15, M5. M1. Thus, the indicator simultaneously analyzes the long-term, medium-term and short-term price behavior before issuing a signal. The indicator is set in the usual way and work
Signal From Level
Yaroslav Varankin
Binary Options Support Resistance Indicator This indicator is designed for binary options trading and effectively shows retracements from support and resistance levels. Signals appear on the current candle. A red arrow pointing downwards indicates a potential selling opportunity, while a blue arrow pointing upwards suggests buying opportunities. All that needs adjustment is the color of the signal arrows. It is recommended to use it on the M1-M5 timeframes as signals are frequent on these timef
First Dawn
Innovicient Limited
The First Dawn indicator uses a unique mechanism to search and plot signals. This keeps searching for signals, making it a great indicator for scaping and identification of changes in direction, swing trading and trend trading. The  First Dawn   helps you get early signals. The backtest gives the true picture of how the indicator works with real/demo accounts. Although this is a tiny indicator it is packed with advantageous settings that will help you whether you desire to: Snap the Peaks and
Angry
Maryna Shulzhenko
Angry is a trend indicator, it indicates well the points of the beginning of the trend and its completion or reversal. This tool scans the market looking for the correct entry. Against the background of insignificant fluctuations, it is possible to identify a trend and indicate its direction. It uses only price data and analytics to calculate entry points. Does not use auxiliary indicators. Angry captures moments of stable price movement direction. There are only three types of trend: Bullish
Indicator. "Indicator wave or Indicator Ma". Using 23 standard indicators and the author's algorithm, the levels of purchases (from 0 to +100) and sales (from 0 to -100) are calculated. Then, using the calculated levels, the "Wave Indicator" draws a wave with 21 moving averages. The wave number is equal to the averaging period of the calculated levels. Waves # 1 - 7 Fast Moving Averages Waves from No. 8 -14 moving averages Waves from No. 15-21 slow moving averages Looking at the figures drawn
"Scalping trading strategy" - the indicator was created for trading using the scalping system. "Scalping trading strategy" shows on the chart with an arrow where the price will go now. After the indicator draws an arrow, the price will go in the direction of the arrow by at least 20 points. This is enough for us to trade effectively. "Scalping trading strategy" does not redraw its signals. The indicator has many different modes of operation. It can draw an arrow both at the beginning of a new c
Fisher Yur4ik Alert
Biswarup Banerjee
Fisher Yur4ik MT4 是一种先进的交易指标,利用技术分析的力量为交易者提供对市场趋势的精准洞察。专为 MetaTrader 4 设计,这个指标非常适合希望提升决策过程和改善交易结果的交易者。 通过使用 Fisher Yur4ik MT4,交易者可以获得竞争优势,实时警报和清晰的视觉信号使他们能够抓住各种金融市场中的盈利交易机会。 MQL 产品安装指南 | 在 MT4/MT5 上更新已购买的 MQL 产品 | 常见故障排除指南 | 指标设置 / 指南 主要特点 缓冲区集成:将指标值暴露为可访问的缓冲区,使 Expert Advisor 能够利用基于信号的交易策略。 快速且可回测:基于 MetaTrader 的原生 OnCalculate() 引擎构建,快速计算并与策略测试器完全兼容。 弹出警报:在信号事件上触发 MetaTrader 警报弹出,确保您不会错过任何交易设置。 推送通知:实时推送通知发送到您的 MetaTrader 移动应用,便于随时监控市场情况。 电子邮件警报:在信号事件上提供电子邮件通知,允许您在离开交易终端时进行远程监控。 图表上的仪表板:在图表上直接显示
The new update makes this indicator a complete tool for studying, analyzing and operating probabilistic patterns. It includes: On-chart Multi-asset percentage monitor. Configurable martingales. Twenty-one pre-configured patterns , including Mhi patterns and C3. An advanced pattern editor to store up to 5 custom patterns. Backtest mode to test results with loss reports. Trend filter. Hit operational filter. Martingale Cycles option. Various types of strategies and alerts. Confluence between patte
Structural Trend Lines
Vincent Jose Proenca
STRUCTURAL TREND LINES - MT4 Indicator Simple indicator that automatically draws trend lines based on market structure. Features: - 3 degrees of structure detection (short, medium, long term) - Configurable swing strength for each degree - Single color per degree for clean visualization - Adjustable number of lines per degree - Customizable colors and line widths How it works: The indicator identifies swing highs and lows based on the strength parameter, then connects these points to create t
MajorAlert
Sergei Vassunov
MajorAlert - is a professional trading indicator for MetaTrader 4 that combines two distinct market analysis approaches into one powerful tool. By integrating a counter‑trend entry logic (upper block) with a trend‑following filter (lower block), the indicator generates high‑probability signals on the chart with clearly separated arrow colors. Key Features Fully self‑contained   – no external indicators required; all calculations are built‑in. Versatile inputs   – adjust all parameters to suit a
Stochastic BR
Antony Augustine
Stochastic BR allows you to recognize reversals professionally. The "Stochastic BR" is designed to recognize profitable counter trend patterns from your chart. Stochastic Indicator: This technical indicator was developed by George Lane more than 50 years ago. The reason why this indicator survived for so many years is because it continues to show consistent signals even in these current times. The Stochastic indicator is a momentum indicator that shows you how strong or weak the current trend i
This indicator displays the ZigZag Pointer Fibonacci Expansion Triangle movements timeframes only M1-W1. Parameters InDepth: Displays the Depth movements. InDeviation: Displays the Deviation movements. InBackstep: Displays the Backstep movements. Fibonacci Expansion: Displays the Fibonacci Expansion movements. Fibonacci Expansion true.(false) Triangle: Displays the Triangle movements. Triangle true.(false) How to understand the status: If the Triangle is green, trend is up. If the Triangle is r
KT Horizontal Lines MT4
KEENBASE SOFTWARE SOLUTIONS
在MetaTrader中,绘制多个   水平线   并跟踪各自的价格水平可能非常麻烦。该指标可自动在等间距位置绘制多个水平线,用于设置价格提醒、标记支撑和阻力位以及其他手动操作。 这个指标非常适合刚接触外汇交易的新手,帮助他们寻找买卖机会并实现快速获利。无论市场处于趋势中还是震荡状态,水平线都能帮助交易者识别潜在的进出场区域。 功能特点 可根据输入参数中的预设,瞬间绘制多个水平线。 使用鲜明的色彩主题,区分不同的水平线。 是追踪多个交易时段价格区间的必备工具。 当价格触及某条水平线时会自动发出提醒。 可设置提醒之间的间隔,避免重复提醒造成干扰。 支持完全自定义设置。 说明 该指标根据输入参数中的配置自动绘制水平线。观察价格在这些水平线附近的反应,可以帮助识别关键支撑/阻力位附近的潜在交易机会。 例如,在水平支撑位形成一根看涨Pin Bar,通常意味着价格可能会继续上涨,朝最近的阻力位移动。 若价格以一根看跌K线收盘于支撑位下方,则可能表明刚刚发生了一个下行突破。而在水平线上发生的假突破,则说明价格未能突破关键水平,可能即将反转方向。 一些价格反转形态(如Pin Bar或假突破)对于
RSI Speed mp
DMITRII GRIDASOV
Crypto_Forex MT4 指标“ RSI SPEED ”——卓越的预测工具,无需重绘。 - 该指标基于物理方程计算。RSI SPEED 是 RSI 本身的一阶导数。 - RSI SPEED 非常适合顺着主趋势方向进行剥头皮交易。 - 建议结合合适的趋势指标使用,例如 HTF MA(如图所示)。 - RSI SPEED 指标显示 RSI 本身方向变化的速度——它非常敏感。 - 建议将 RSI SPEED 指标用于动量交易策略:如果 RSI SPEED 指标的值小于 0:价格动量下降;如果 RSI SPEED 指标的值大于 0:价格动量上升。 - 指标内置移动端和 PC 端警报。 ................................................... 点击这里查看高质量的交易机器人和指标! 这是仅在 MQL5 网站上提供的原创产品。
Phase Analytics Pro: Advanced Cyclic Market Analyzer Phase Analytics Pro is a sophisticated technical tool designed for traders who prioritize mathematical precision over lag-heavy traditional indicators. Based on the principles of digital signal processing, this indicator decomposes price action into phase and quadrature components to identify the dominant market cycle. How it works: The algorithm calculates the instantaneous phase of the market, allowing it to distinguish between trending and
This is a new strategy for SUPPLY DEMAND areas It is based on a calculation using the tick volume to detect the big price action in market for both bear /bull actions this smart volume action candles are used to determine the supply and demand areas prices in between main supply and demand lines indicate sideway market  up arrows will be shown when prices moves above the main supply and the secondary supply lines Down arrows will be shown when prices moves below the main demand and the secondary
Alpha Trend sign Alpha Trend sign 是我么长期以来非常受欢迎的交易工具,它可以验证我们的交易系统,并且明确的提示交易信号,并且信号不会漂移。 主要功能: •  根据市场显示活跃区域,根据指标可以很直观的判断当前行情是属于趋势行情,还是震荡行情。    并根据指标的指示箭头切入市场,绿色箭头提示买入,红色箭头提示卖出。 •  建议使用5分钟以上的时间周期进行交易,避免因为小周期波动出现频繁的交易信号。 •  您也可以开启信号提示,以免错过最佳的交易时机。 •  本指标不但可以很好的预测趋势行情,也可以在宽幅震荡行情中获利。 •  本指标本着大道至简的原则,适合不同阶段的交易者使用。 注意事项: •  Alpha Trend sign 有明确的进出场信号,不建议逆势操作,以免造成损失。 •  Alpha Trend sign 是特别成熟的指标,我们团队人手一个,使用它可以实现稳定盈利。     
Royal Dutch Skunk
Sayan Vandenhout
ROYAL DUTCH SKUNK USES THE TREND WAVE INDICATOR AND IT CAN IDENTIFY THE BEGINNING AND THE END OF A NEW WAVE TREND MOVEMENT. AS AN OSCILLATOR, THE INDICATOR IDENTIFIES THE OVERBOUGHT AND OVERSOLD ZONES. IT WORKS GREAT TO CATCH THE SHORT TERM PRICE REVERSALS AND USES A MARTINGALE STRATEGY TO CLOSE ALL TRADES IN PROFIT. USE DEFAULT SETTINGS ON H1 OR HIGHER TIME FRAME ON ANY PAIR FOR MORE ACCURATE TRADES WHY THIS EA : Smart entries calculated by 6 great strategies The EA can be run on even a $20000
NO REPAINT ADVANCED CHART PATTERN INDICATOR By definition, a price ( chart)  pattern is a recognizable configuration of price movement that is identified using a series of  trendlines  and/or curves. When a price pattern signals a change in trend direction, it is known as a reversal pattern; a continuation pattern occurs when the trend continues in its existing direction following a brief pause. Advanced Chart Pattern Tracker is designed to find the MOST ACCURATE patterns. A special script is a
SuperTrend Alerts
Libertas LLC
3 (4)
SuperTrend Alerts adds alerts to the widely popular SuperTrend indicator. As the name suggests, SuperTrend is a trending indicator which works best in trendy (not choppy) markets. SuperTrend is extremely popular for intraday and daily trading, and can be used on any timeframe. Place a call when the price closes above the SuperTrend line, and place a put when the price closes below the SuperTrend line. These crossovers are highlighted by non-repainting up/down arrows. Alerts Email, message and s
头肩形态是一种图表形式,类似于具有三个峰的基线,外部两个峰的高度接近,中间峰最高。它可以预测牛市到牛市的趋势反转,并且被认为是最可靠的趋势反转模式之一。它是几种顶部模式之一,以不同程度的准确性发出趋势即将结束的信号。 [ 安装指南 | 更新指南 | 故障排除 | 常见问题 | 所有产品 ] 清除交易信号 可自定义的颜色和尺寸 实施绩效统计 可定制的斐波那契回撤水平 显示适当的止损和获利水平 该指标可用于查找连续或反转形态 它是不可重涂和不可重涂的 它实现了电子邮件/声音/视觉警报 设置 将指标加载到任何图表时,将显示一组选项作为输入参数。如果您认为它们太多,请不要感到失望,因为参数被分组为不言自明的块。这就是每个参数块的作用。 幅度-幅度表示替代价格点之间的最小柱线量。要找到大图案,请增加幅度参数。要查找较小的模式,请减小幅度参数。您可以在图表中多次加载具有不同幅度的指标。 闵。回撤-形态中所需的最小斐波那契回撤。设置为零不对其进行评估。 最大。回撤-形态中可能的最大斐波那契回撤。设置为零不对其进行评估。 领口扁平率-此参数描述图案领口必须如何“平坦”。 最大历史柱线-指标在图
Auto Fibo Pro m
DMITRII GRIDASOV
“Auto FIBO Pro” Crypto_Forex 指标 - 是交易中的绝佳辅助工具! - 指标自动计算并放置在图表斐波那契水平和局部趋势线(红色)上。 - 斐波那契水平指示价格可能反转的关键区域。 - 最重要的水平是 23.6%、38.2%、50% 和 61.8%。 - 您可以将其用于反转剥头皮或区域网格交易。 - 还有很多机会可以使用 Auto FIBO Pro 指标来改进您当前的系统。 - 它具有信息价差掉期显示 - 它显示所连接的外汇对的当前价差和掉期。 - 显示屏还显示账户余额、净值和保证金。 - 可以将信息价差掉期显示定位在图表的任何角落: 0 - 左上角,1 - 右上角,2 - 左下角,3 - 右下角。 点击这里查看高质量的交易机器人和指标! 这是仅在此 MQL5 网站上提供的原创产品。
这是一个预测蜡烛收盘价的指标。 该指标主要用于 D1 图表。 该指标适用于传统外汇交易和二元期权交易。 该指标可以用作独立的交易系统,也可以作为您现有交易系统的补充。 该指标分析当前蜡烛,计算蜡烛本身内部的某些强度因素,以及前一根蜡烛的参数。 因此,该指标预测市场走势的进一步方向和当前蜡烛的收盘价。 由于这种方法,该指标既适用于短期盘中交易,也适用于中长期交易。 该指标允许您设置指标在分析市场情况期间将产生的潜在信号的数量。 在指标设置中有一个特殊的参数。 此外,该指标可以通过图表上的消息、电子邮件以及推送通知的形式通知新信号。感谢您的关注!交易愉快! 购买后一定要写信给我! 我会给你我的交易指标的建议! 还可以获得奖金!
该产品的买家也购买
Gann Made Easy
Oleg Rodin
4.83 (162)
Gann Made Easy 是一个专业且易于使用的外汇交易系统,它基于使用先生理论的最佳交易原则。 W.D.江恩。该指标提供准确的买入和卖出信号,包括止损和获利水平。您甚至可以使用推送通知在旅途中进行交易。 购买后请联系我,即可免费获得交易指导和超棒的额外指标! 您可能已经多次听说过江恩交易方法。通常 Gann 的理论不仅对于新手交易者而且对于那些已经有一定交易经验的人来说都是非常复杂的东西。这是因为江恩的交易方法在理论上并不那么容易应用。我花了几年时间来完善这些知识,并将最好的原则应用到我的外汇指标中。 该指标非常易于应用。您所需要的只是将其附加到您的图表并遵循简单的交易建议。该指标不断进行市场分析工作并寻找交易机会。当它检测到一个好的入口点时,它会为您提供一个箭头信号。该指标还显示止损和获利水平。 换句话说,当您像先生一样进行交易时,该指标会为您提供最佳江恩建议。江恩亲自告诉你此时此刻该做什么。但最好的部分是您不需要了解任何有关江恩交易原则的知识,因为该指标会为您完成整个市场分析工作。
The Propfolio Master Suite is the ultimate all-in-one analytical workstation for professional traders. Combining the power of the Beat The Market Maker (BTMM) methodology, Smart Money Concepts (SND/Liquidity), and Advanced Volume Profile, this suite replaces multiple different indicators with one optimized engine. Monitor up to 14 pairs simultaneously from a single chart, instantly identify market cycles, and seamlessly map institutional footprints with the click of a button. The Command Center
M1 Sniper
Oleg Rodin
5 (23)
M1 SNIPER 是一款易于使用的交易指标系统。它是一个专为 M1 时间框架设计的箭头指标。该指标可以作为独立的系统在 M1 时间框架下进行剥头皮交易,也可以作为您现有交易系统的一部分使用。虽然该交易系统专为 M1 时间框架交易而设计,但它也可以用于其他时间框架。我最初设计此方法是为了交易 XAUUSD 和 BTCUSD。但我发现这种方法在其他市场交易中也同样有用。 指标信号既可以顺势交易,也可以逆势交易。我教授一种特殊的交易技巧,帮助您利用指标信号进行双向交易。该方法基于使用特殊的动态支撑位和阻力位区域。 购买后,您可以立即下载 M1 SNIPER 箭头指标。此外,我还为所有 M1 SNIPER 工具用户免费提供下方屏幕截图所示的 Apollo Dynamic SR 指标!这两个指标的组合可以帮助您更轻松、更准确地利用 M1 时间框架进行交易。 购买后请联系我,免费获取交易提示和奖励指标! 祝您交易成功!
Auto Optimized Parabolic RSI: 高级 3D 动量引擎 大多数零售指标之所以失效,是因为它们依赖于静态输入,一旦市场波动率发生变化,这些输入就会崩溃。Auto Optimized Parabolic RSI 通过不断重新计算自身的数学优势,解决了“指标衰退”的问题,将机构级别的量化自适应能力直接引入您的 MT5 终端。 核心优势:定制的内存 3D 优化   标准的自动优化器通常会导致 MT5 平台卡顿,因为它们通过标准的指标调用使终端超载。该工具完全绕过了这些性能瓶颈。内部引擎采用定制的原生基于 RAM 的计算器构建,每次加载图表或更改时间周期时,它都会执行极速的 3D 网格搜索。它同时扫描 RSI 周期(频率)、SAR 步长(加速度)和 SAR 最大值(速度限制),在绝对的毫秒级时间内测试数以万计的参数组合,且完全不会拖慢您的平台。它不是仅仅寻找一个“不错”的设置,而是映射整个参数空间,以寻找资产当前动量结构的绝对全局最大值。 严格的财务评分与逼真的交易模拟   与基于抽象“指标点数”进行优化评分的业余工具不同,该引擎的 3.10 版本严格与资金数学挂钩。每
PZ Harmonacci Patterns
PZ TRADING SLU
3.17 (6)
可以说,这是您可以为MetaTrader平台找到的最完整的谐波价格形成自动识别指标。它检测19种不同的模式,像您一样认真对待斐波那契投影,显示潜在的反转区域(PRZ),并找到合适的止损和获利水平。 [ 安装指南 | 更新指南 | 故障排除 | 常见问题 | 所有产品 ] 它检测19种不同的谐波价格形态 它绘制了主要,衍生和互补的斐波那契投影(PRZ) 它评估过去的价格走势并显示每个过去的形态 该指标分析其自身的质量和性能 它显示合适的止损和获利水平 它使用突破来表明合适的交易 它在图表上绘制所有样式比率 它实现了电子邮件/声音/视觉警报 受斯科特·M·卡尼(Scott M. Carney)的书的启发,该指标旨在满足最纯粹和最熟练的交易者的需求。但是,它采取了一种使交易更容易的方式:在向交易发出信号之前,它会等待Donchian朝正确方向突破,从而使交易信号非常可靠。 斐波那契投影与向量无关 它实现了电子邮件/声音/推送警报 它绘制了ABCD投影 重要提示: 为了符合 Scott M. Carney先生 的商标申诉,某些图案名称已重命名为不言自明的替代方式, Scott M.
Scalper Inside PRO
Alexey Minkov
4.74 (69)
Scalper Inside PRO – Since 2020. An exclusive indicator that utilizes an innovative algorithm to swiftly and accurately determine the market trend. The indicator automatically calculates opening, closing, and profit levels, providing detailed trading statistics. With these features, you can choose the most appropriate trading instrument for the current market conditions. Additionally, you can easily integrate your own arrow indicators into Scalper Inside Pro to quickly evaluate their statistics
PRO Renko System
Oleg Rodin
5 (30)
PRO Renko Arrow Based System for trading renko charts.  准确的信号交易任何外汇工具. 另外,我将免费提供系统的附加模块! PRO Renko系统是RENKO图表上高度准确的交易系统。该系统是通用的。 该交易系统可应用于各种交易工具。 该系统有效地中和了所谓的市场噪音,打开了获得准确反转信号的通道。 该指标易于使用,只有一个参数负责产生信号。 您可以很容易地使算法适应您感兴趣的交易工具和renko酒吧的大小。 我很乐意通过提供任何咨询支持来帮助所有客户有效地使用该指标。 祝您交易成功!购买后,立即写信给我! 我将与您分享我的建议和我的renko发电机。 另外,我将免费提供系统的附加模块!
Quants HL Break
Ferhat Mutlu
5 (2)
通過純價格行為進行高級計算,以找到 LH 和 HL 突破。 它會給你一個很好的市場反轉點。 LH 和 HL 信號也可用於 traingle 突破。 一旦突破發生,則表明強烈反轉。 移動平均線的漂亮過濾器。 我強烈建議將其與趨勢指標一起使用。 可用作支撐和阻力、供需指標的額外確認。 可以在以下外匯線程中找到更多詳細信息: 該指標未重新繪製。 Buffers :   SetIndexBuffer ( 0 ,UpBar);      SetIndexBuffer ( 1 ,UpBar2);           SetIndexBuffer ( 2 ,DnBar);      SetIndexBuffer ( 3 ,DnBar2);           SetIndexBuffer ( 4 ,UpBarTop);      SetIndexBuffer ( 5 ,UpBarLow);                    SetIndexBuffer ( 6 ,DnBarTop);      SetIndexBuffer ( 7 ,DnBarLow);           SetIn
Quantum Breakout Indicator PRO
Bogdan Ion Puscasu
4.96 (26)
介绍     Quantum Breakout PRO   ,突破性的 MQL5 指标,正在改变您交易突破区域的方式!   Quantum Breakout PRO 由拥有超过 13 年交易经验的经验丰富的交易者团队开发,旨在通过其创新和动态的突破区域策略将您的交易之旅推向新的高度。 量子突破指标将为您提供带有 5 个利润目标区域的突破区域的信号箭头,以及基于突破框的止损建议。 它既适合新手交易者,也适合专业交易者。 量子 EA 通道:       点击这里 MT5版本:   点击这里 重要的!购买后请私信我领取安装手册。 建议: 时间范围:M15 货币对:GBPJPY、EURJPY、USDJPY、NZDUSD、XAUUSD 账户类型:ECN、Raw 或 Razor,点差极低 经纪商时间:GMT +3 经纪商:IC Markets、Pepperstone with Raw 和 Razor 的点差最低 规格: 不重漆! 最多 5 个建议利润目标区域 建议止损水平 可定制的盒子。您可以设置自己的 Box Time Start 和 Box Time End。 接触 如果您
购买此指标即可免费获得我的专业交易管理器。 首先,值得强调的是,这个交易系统是一个非重绘、非重画和非滞后的指标,这使得它非常适合手动和机器人交易。 在线课程,手册和下载预设。 “智能趋势交易系统 MT5”是专为新手和经验丰富的交易者量身定制的综合交易解决方案。它结合了超过 10 个优质指标,具有 7 多个强大的交易策略,使其成为适用于各种市场条件的多功能选择。 趋势跟随策略:提供精确的入场和止损管理,以有效地跟随趋势。 反转策略:识别潜在的趋势反转,使交易者能够利用区域市场的机会。 剃头策略:专为快速准确的日内交易和短期交易而设计。 稳定性:所有指标都不会重绘、不会重画和不会滞后,确保可靠的信号。 定制:支持自定义策略,以满足个人交易偏好。超过 7 种策略和组合可帮助您找到最佳策略。 信号清晰度:提供箭头信号,以指示清晰的入场和退出点。 实时警报:通过交易进出警报使交易者保持了解。 深入分析:提供更高时间框架的趋势分析和实时交易监控。 自适应颜色编码:利用蜡烛颜色编码来显示成交量、趋势和反转蜡烛信号。通过蜡烛颜色分析市场方向。 “智能趋势交易系统 MT5”赋予交易者必要的工具,以便在
Advanced Currency Strength28 Indicator
Bernhard Schweigert
4.91 (657)
目前40%的折扣 任何新手或专家交易者的最佳解决方案! 这个指标是一个独特的、高质量的、可负担得起的交易工具,因为我们纳入了一些专有的功能和一个新的公式。只需一个图表,你就可以读出28个外汇对的货币强度!想象一下,你的交易将如何得到改善,因为你的交易是在你的手中进行的。想象一下,你的交易将如何改善,因为你能够准确地确定新趋势或剥头皮机会的触发点? 用户手册:点击这里  https://www.mql5.com/en/blogs/post/697384 这是第一本,原版的! 不要买一个毫无价值的崇拜者的克隆品。 特别的 子窗口中的箭头显示强劲的货币势头GAP将指导你的交易! 当基础货币或报价货币处于超卖/超买区域(外盘斐波那契水平)时,在个人图表的主窗口中出现警告信号。 当货币力量从外围区间回落时,回撤/反转警报。 十字星模式的特别警报 可选择多个时间框架,以快速查看趋势! 货币强度线在所有的时间框架中都非常平稳,当使用较高的时间框架来识别总体趋势,然后使用较短的时间框架来确定精确的入口时,效果非常好。你可以根据自己的意愿选择任何时间框架。每个时间框架都由其自身进行了优化。
GoldRush Trend Arrow Signal
Kirk Lee Holloway
5 (2)
GoldRush 趨勢箭頭信號 GoldRush 趨勢箭頭信號 指標為 XAU/USD 中的高速、短期短線交易者提供精確、實時的趨勢分析。 專為1分鐘時間框架設計,此工具顯示方向箭頭以明確顯示入場點,使短線交易者能在波動市場中自信操作。 該指標包含主要和次要警示箭頭。主要信號為白色和黑色方向箭頭,用於指示趨勢方向的轉變;次要信號為藍色和紅色箭頭,用於確認主要箭頭指示的方向並提示潛在交易入場點。 注意:當趨勢方向發生變化後僅出現一個主要警報箭頭時,請注意可能會出現多個次要藍/紅箭頭。次要信號將在滿足信號標準的任何蠟燭圖後出現,因此在長期趨勢移動中,螢幕上將顯示大量次要箭頭(如附帶的截圖所示)。您可在設置中開啟或關閉任一箭頭類型。 以下是我使用此指標進行交易的方式: - 對於買入入場,我會耐心等待白箭頭在蠟燭收盤時出現,並在下一根可用蠟燭收盤時出現藍箭頭時進行買入交易。 - 對於賣出入場,我會耐心等待黑箭頭在蠟燭收盤時出現,並在下一根可用蠟燭收盤時出現紅箭頭時進行賣出交易。 - 獲利了結/止損設置由使用者自行負責,但我個人使用最低R:R為1:2,並發現這在倫敦/紐約開盤等
Day Trader Master
Oleg Rodin
5 (15)
Day Trader Master 是一个完整的日间交易者交易系统。该系统由两个指标组成。一个指标是买入和卖出的箭头信号。这是你得到的箭头指示器。我将免费为您提供第二个指标。第二个指标是专门设计用于与这些箭头结合使用的趋势指标。 指标不重复也不迟到! 使用这个系统非常简单。您只需按照当前趋势方向的箭头信号,显示为双色线。蓝色是买入趋势。红色是一种销售趋势。蓝色箭头是买入信号。红色箭头是卖出信号。您需要箭头的颜色和信号的方向来匹配趋势线的颜色。 箭头指标主要是为 M5 和 M15 时间间隔的日内交易而创建的。但从技术上讲,该系统可以用于其他时间间隔。 指示器配备带有推送消息功能的弹出警报。 购买后一定要写信给我!我将为您提供与系统交易的个人建议,以及我的趋势指标。此外,还有丰厚的奖励等着您!
Apollo SR Master
Oleg Rodin
5 (2)
Apollo SR Master 是一款支撑/阻力指标,其特殊功能使利用支撑/阻力区域进行交易更加便捷可靠。该指标通过检测局部价格顶部和底部,实时计算支撑/阻力区域,没有任何时间延迟。为了确认新形成的支撑/阻力区域,该指标会显示特殊信号,表明该支撑/阻力区域可以作为实际的卖出或买入信号。在这种情况下,支撑/阻力区域的强度会增强,因此从该区域进行交易的成功率也会更高。这正是该指标的核心理念。 SR区域也使止损和止盈的操作更加便捷。根据信号方向,可以将SR区域上方或下方的空间用作止损位。此外,相对的SR区域也可以用作潜在的止盈区域。 我还免费向所有 Apollo SR Master 指标的用户提供我的“Apollo 价格行为系统”指标。这两个指标结合使用将帮助您找到更好的入场点。 购买后请联系我,即可免费获得我的交易技巧以及我的“阿波罗价格行为系统”指标作为赠品!
Market Makers
Mohamed Hassan
5 (4)
After purchase, contact me privately to receive 1 month of free testing with EA Forex Proton! This advanced MT4 trading robot automatically executes signals from any MT4 indicator, including Market Makers. The latest version also includes AI integration, allowing each trade signal to be analyzed using Artificial Intelligence. Live Signal with EA Forex Proton: Click here Market Makers is a powerful price action trading system designed to identify high-probability Buy and Sell opportunities based
Market Structure Patterns MT4
Samuel Manoel De Souza
5 (18)
Market Structure Patterns   is an indicator based on   smart money concepts   that displays   SMC/ICT   elements that can take your trading decisions to the next level. Take advantage of the   alerts ,   push notifications   and   email messages   to keep informed from when an element is formed on the chart, the price crosses a level and/or enters in a box/zone. Developers can access the values of the elements of the indicator using the   global variables  what allows the automation of trading d
Advanced Supply Demand
Bernhard Schweigert
4.91 (300)
现在优惠 40%! 任何新手或专业交易者的最佳解决方案! 该指标是一款独特、高质量、且价格合理的交易工具,因为我们已经整合了许多专有功能和新公式。 依据此更新,您将能够显示双重时间帧区域。 您不仅可以显示一个较高的时间帧,还可以同时显示图表时间帧,加上更高的时间帧:显示嵌套时区。 供需双方所有交易者都会喜欢它。 :) 重要信息披露 高级供需的最大潜力,请访问 https://www.mql5.com/zh/blogs/post/720245   想象您的交易如何得以改善,是因为您能够精准定位入场或目标位吗? 构建于新的底层算法,它可以更轻松地识别出买卖双方之间的潜在失衡。 这是因为它以图形方式展示供需最强劲区域,及其过去的表现(显示旧区域)。 这些功能旨在帮助您更轻松地发现最佳入场区域和价位。 现在您可以针对您的交易品种和时间帧来优化和编辑区域强度! 高级供需指标适用于所有产品和时间帧。 它是一个新的公式,非常新的功能是两个区域强度函数可由用户输入进行调整! 这在交易中是一大优势。 当您学习如何使用专有功能,例如带有价格游离最小 X 因子的区域强度时,您能够判断该区域强劲与否。 供需
CRT Candle Range Theory HTF MT4.   Ultimate CRT Indicator: Advanced ICT Concepts and Malaysian SnR Trading System Discounted   Price   $50  !!     Secure your lifetime access   now   before it switches to   subscription-only ! Master the Market Maker's Footprints with the Most Advanced Candle Range Theory Indicator Unlock the true power of   Smart Money Concepts (SMC)   and trade precisely like the institutions with the   Ultimate CRT Indicator . Built exclusively for serious traders, this indic
PZ Turning Points MT4
PZ TRADING SLU
1 (1)
该指标检查不同时期分形的价格结构,以确定市场中可能的反转点,从而为已经具有基本或技术估值模型的仓位交易者提供时机。与它的弟弟 Reversal Fractals不同 ,该指标不会因为所选时期而错过反转,并且会以之字形方式找到反转分形,而忽略那些没有足够动量来引发持续价格波动的反转。 [ 安装指南 | 更新指南 | 故障排除 | 常见问题 | 所有产品 ] 转折点可以开始长期趋势 指示器不重涂 它实现了各种警报 可自定义的颜色和尺寸 该指示符是无功或滞后信号,因为分形是奇数个条形的地层,是中间地带中最高或最低的条形,并且指示符在分形中的所有条形都闭合时绘制。但是,具有预先设定的方向偏差的交易者会发现该指标非常有用,可以提早进入切入点。 该指标既不是下探信号指标,也不是完整的交易系统。请不要这样评价或审查它。 输入参数 最小分形数:分形上的最小条形数。必须为奇数,例如3、5、7、9、11、13,... 最大分形:分形上的最大条形数量。必须为奇数,例如3、5、7、9、11、13 ... 最大历史柱数:指标加载时评估的过去柱数。 颜色:自定义箭头和线条的颜色和大小。 警报:启用或禁用各
Dynamic Scalper System
Vitalyi Belyh
5 (1)
“ Dynamic Scalper System ”指标专为在趋势波内进行剥头皮交易而设计。 已在主要货币对和黄金上进行测试,并可与其他交易工具兼容。 提供顺势短线建仓信号,并提供额外的价格变动支持。 指标原理: 大箭头决定趋势方向。 在趋势波内,我们采用一种生成小箭头形式的剥头皮交易信号的算法。 红色箭头代表看涨方向,蓝色箭头代表看跌方向。 敏感的价格变动线会沿着趋势方向绘制,并与小箭头信号协同作用。 信号运作方式如下:当线在适当时刻出现时,将形成入场信号;在出现线时,持仓;线完成后,平仓。 建议的操作时间范围为M1 - H4。 箭头在当前K线上方形成,如果下一根K线已开仓,则不会重新绘制上一根K线上方的箭头。 输入参数 Trend Wave Period - 趋势方向(大箭头)的周期,改变趋势波的时间间隔。值 1 表示趋势方向的最长持续时间,参数值越大,持续时间越短。 Scalper Arrows Period - 信号箭头(小箭头)的计算周期,改变入场信号的生成频率。值 3 表示最频繁的生成频率,参数值越大,箭头频率越低,准确度越高。 这些参数可以根据不同的时间范
They say history repeats itself. What if you could prove it in real-time? The Propfolio Ghost Pattern is an advanced algorithmic pattern-matching engine. It empowers you to select any current price action structure on your chart and instantly scan thousands of historical candles to find the exact moment in the past where the market did the exact same thing. Once it finds the highest probability match, it projects the historical outcome into the future as "Ghost Candles"—giving you a highly calcu
目前有26%的折扣!! 这个指标是我们两个主要指标( Advanced Currency Strength 28   &  Advanced Currency IMPULSE with ALERT )的一个超级组合。它显示了28个外汇对的TICK-UNITS货币强度值和警报信号。可以使用11种不同的Tick-Units。它们是1、2、3、4、5、6、10、12、15、20和30秒。子窗口中的Tick-Unit栏将被显示并向左移动,当在一秒钟的定时器中至少有一个Tick。 只用一个图表,你就可以剥28个外汇货币对的头皮!想象一下,你的剥头皮将如何提高。想象一下,你的剥头皮将如何改善,因为你能够准确地确定剥头皮机会的触发点? 这是市场上第一个在比1分钟更短的时间内工作的货币强度指标! 它是为那些希望快速进出并从市场中切出小点数的快速剥头皮者准备的。 用户手册:点击这里 https://www.mql5.com/en/blogs/post/727178 特点。 为28个货币对提供嘀嗒单位的卖出/买入警报,有一个按钮可以快速打开目标图表。 在3种敏感模式中选择一种(慢-中-快
Atomic Analyst
Issam Kassas
5 (5)
首先值得强调的是,该交易指标是非重绘、非延迟的指标,这使其成为手动和机器人交易的理想选择。 用户手册:设置、输入和策略。 Atomic Analyst是一种PA价格行动指标,利用价格的力量和动量来寻找市场上更好的机会。配备了高级过滤器,可帮助去除噪音和假信号,并提高交易潜力。使用多层复杂的指标,Atomic Analyst扫描图表,并将复杂的数学计算转化为任何初学者都能理解并用来做出一致交易决策的简单信号和颜色。 “Atomic Analyst”是专为新手和经验丰富的交易者量身定制的综合交易解决方案。它将高级指标和一流功能融合为一体的交易策略,使其成为所有类型交易者的多功能选择。 日内交易和剥头皮策略:专为快速准确的日内交易和短期交易而设计。 日内和摆动交易策略:可用作追求价格大幅波动的日内和摆动交易者的可靠工具。 多货币和市场:凭借其可靠的精度,在不同的工具和市场上运作。 多个时间框架:可在多个时间框架上使用,性能良好。 稳定性:所有指标均不重绘、不重绘和不滞后,确保可靠的信号。 信号清晰度:提供箭头信号,用于清晰的入场和出场点。 实时警报:通过交易入场、SL和TP警报通知交易者
KURAMA GOLD SIGNAL PRO(MT4版)— 7层过滤器、自动TP/SL、品质评分搭载 XAUUSD完整交易系统 不重绘。不重画。不延迟。每个信号永久固定。所见即所得。 福利:购买买断版许可证可免费获得 AI Zone Radar(价值$59)+ 完整PDF手册。购买后请给我发消息。 AI Zone Radar: https://www.mql5.com/en/market/product/175834 交易员的信赖:已被活跃的黄金交易员社区使用。因精度和易用性获得赞誉。 你的问题 — 以及解决方案 你知道黄金每天波动$30-50。你知道这里有钱可赚。但是: - 入场过早,价格反向$10后才朝你的方向走 - 每次MA触碰都入场,结果一半都失败 - 没有TP/SL系统,所以持仓太久或离场太早 - 在死寂时段交易,然后想为什么什么都不顺 KURAMA GOLD SIGNAL PRO解决了这一切。不是用一个过滤器,而是七个。 工作原理 — 3步 1. 图表上出现箭头信号 2. 在面板上查看TP价格、SL价格、品质评分、风险回报比 3. 下单并等待 无
PZ Double Top Bottom
PZ TRADING SLU
5 (1)
该指标找到双顶和双底反转形态,并使用突破引发交易信号。 [ 安装指南 | 更新指南 | 故障排除 | 常见问题 | 所有产品 ] 清除交易信号 可自定义的颜色和尺寸 实施绩效统计 可定制的斐波那契回撤水平 它显示合适的止损和获利水平 它实现了电子邮件/声音/视觉警报 这些图案可以扩展,并且指示器通过重新绘制跟随图案。但是,该指标采用了一种扭曲方式,以使其更容易交易:它在向交易发出信号之前等待Donchian突破,然后发出交易信号,使其信号非常可靠,并且几乎没有重涂。 输入参数 幅度:幅度表示替代价格点之间的最小柱线量。要找到大图案,请增加幅度参数。要查找较小的模式,请减小幅度参数。 闵。回撤:形态中所需的最小斐波那契回撤。 最大。回撤:形态中可能的最大斐波那契回撤。 最大历史柱数:指标在图表中加载时要评估的过去柱数。 显示统计信息:显示或隐藏统计信息显示板和效果数据。 显示SL / TP电平:显示或隐藏每个信号的合适的止损和获利水平。 绘图选项:看涨或看跌的线条和标签的颜色和大小以及字体大小。 突破:突破箭头的颜色和大小。 警报:启用或禁用各种警报。 作者 Arturo
Gold Scalper Super
Aleksandr Makarov
5 (2)
Gold Scalper Super is an easy-to-use trading system. The indicator can be used as a standalone scalping system on the M1 time frame, as well as part of your existing trading system. Bonus: when purchasing an indicator, Trend Arrow Super is provided free of charge, write to us after purchase. The indicator 100% does not repaint!!! If a signal appears, it does not disappear! Unlike indicators with redrawing, which lead to the loss of a deposit, because they can show a signal and then remove it.
Cyclic Impulse
Vitalyi Belyh
构建图表并识别周期性价格变动的技术指标。 可以在任何图表上工作。 几种类型的通知。 图表本身还有额外的箭头。 无需重新绘制历史记录,只需关闭蜡烛即可。 建议使用 M5 及以上的 TF。 易于使用和配置参数。 当使用 2 个具有不同参数的指标时,您可以单独使用它们,而无需其他指标。 有 2 个输入参数 周期性和信号持续时间 这两个参数处理图表结构的处理。 Cyclicity 调节反转周期的变化频率,平滑周期。 Signal duration 为最小数字,检测价格变动中的脉冲,最大长期趋势变动。    ---------------------------------------------------------------------------------------
KuKl
IGOR KIRIANEN
The indicator is built on a non-standard Zig Zag, it draws accumulations after which if the price leaves this zone and a test of this zone occurs, then a sound signal is given and an arrow appears - after the test candle closes.The indicator does not redraw its signals, it is very easy to use, there are only three settings 1- this is the zig zag parameter 2- this is the minimum price exit from the zone 3- this is the maximum price exit from the zone. The lower the parameter for Zig Zag, the more
Trend Screener
STE S.S.COMPANY
4.79 (95)
趋势指标,趋势交易和过滤的突破性独特解决方案,所有重要趋势功能都内置在一个工具中! 它是 100% 非重绘多时间框架和多货币指标,可用于所有符号/工具:外汇、商品、加密货币、指数、股票。 限时优惠:支撑和阻力筛选指标仅售 65美元,终身有效。(原价 250 美元)(优惠延长) 趋势筛选器是有效的指标趋势跟踪指标,它在图表中提供带有点的箭头趋势信号。 趋势分析器指标中可用的功能: 1.趋势扫描仪。 2. 具有最大利润分析的趋势线。 3.趋势货币强度计。 4. 带有警报的趋势反转点。 5. 带有警报的强趋势点。 6. 趋势箭头 每日分析示例,每日信号表现...等与我们的趋势筛选指标,可以在这里找到: 点击这里 限时优惠:Trend Screener Indicator 仅售 150 美元且终身可用。原价 199$) 通过访问我们的 MQL5 博客,您可以找到我们所有的高级指标以及分析示例、每日信号表现...等。 : 点击这里 我们的趋势系统由 2 个指标组成: 1. Trend Screener Indicator:显示趋势仪表盘、图表中的趋势线、入场点...等。 2. Trend
Advanced UT BOT ALERTS for MT4 專業多重濾波趨勢識別系統|強化版 UT BOT 引擎 我們只提供高品質的指標。 Advanced UT BOT 為專業交易者設計,採用穩定的信號邏輯與安全運算結構,確保無延遲與錯誤更新。 它 不會重繪、不會重畫、不會刪除或修改 任何過去的信號。 所有 BUY 和 SELL 信號均在 K 線收盤後生成並固定 ,確保穩定性與準確性。 在即時行情中 不會重繪 ,信號會在收盤後即時出現。 限時優惠中 —— 下一次價格將調整為 49 美元。 請把握現在的優惠價格,售完即漲。 產品概述 Advanced UT BOT ALERTS   是新一代的趨勢信號系統,基於   UT BOT   的核心邏輯重新打造, 全面升級為 MT5 版本,融合多重濾波、動態視覺化與高精度警報系統。 UT Bot 指標最初由   Yo_adriiiiaan   開發,本版本由   PioneerAlgoFX   團隊深度強化, 在穩定性、精準度與自訂性方面均達到專業級水準,為實戰交易者而設計。 此系統能夠高精準地識別趨勢反轉與動能變化, 透過多層動態濾波與
作者的更多信息
ADX arrow
Pavel Shutovskiy
5 (1)
ADX arrow 该指标将   ADX indicator   (平均方向移动指数)的信号显示为图表上的点。 这便于信号的视觉识别。 该指示器还具有警报(弹出消息框)和向电子邮件发送信号。          参数 Period     -平均周期。 Apply to   -用于计算的价格:关闭,开放,高,低,中位数(高+低)/2,典型(高+低+关闭)/3,加权关闭(高+低+关闭+关闭)/4。 Alert     -启用/禁用警报。 EMail     -启用/禁用向电子邮件发送信号。 Period  - averaging period. Apply to  - price used for calculations: Close, Open, High, Low, Median (high+low)/2, Typical (high+low+close)/3, Weighted Close (high+low+close+close)/4. Alert  - enable/disable alerts. EMail  - enable/disable sending s
OsMA Arrow MTF
Pavel Shutovskiy
3.9 (10)
The indicator displays crossing zero level by Moving Average of Oscillator (OsMA) in the form of arrows. The this is a multi-timeframe indicator, and it displays signals from other timeframes. The indicator notifies about a signal by means of a pop-up Alert window, or sending notification to e-mail. Parameters Time-frame - select timeframe to show indicator signals. Fast EMA Period - fast EMA. This is an exponential moving average from a price with a short period. Slow EMA Period - slow EMA. Th
FREE
OsMA Arrow
Pavel Shutovskiy
3.83 (6)
The indicator displays crossing zero level by Moving Average of Oscillator (OsMA) in the form of arrows. The indicator notifies about a signal by means of a pop-up Alert window, or sending notification to e-mail. Parameters Fast EMA Period - fast EMA. This is an exponential moving average from a price with a short period. Slow EMA Period - slow EMA. This is also an exponential moving average of a market price but with a longer period. Signal SMA Period - MACD SMA. This is a signal line which is
FREE
AC Arrow
Pavel Shutovskiy
4 (2)
The indicator displays zero level Accelerator Oscillator (AC) crossover in the form of dots on the chart. In indicator settings one can specify number of bars in the history to display signals, as well as shift of dots with respect to a bar. Parameters Bars — number of bars in the history to display indicator's signals; Shift — shift of dots with respect to bars.
FREE
Reversal signal mtf
Pavel Shutovskiy
The indicator displays trend reversal in the form of arrows. The indicator does not change its values (is not redrawn) after a signal. The program notifies about arrows by means of a pop-up window, or sending notification to e-mail. This is a multitimeframe instrument. Values of the indicator may be displayed from higher timeframes. Parameters Time-frame - select time session; zero is the current timeframe (Time-frame cannot be lower than the current time interval). Bars - number of bars on the
AD Trend line
Pavel Shutovskiy
5 (1)
AD Trend line draws trend lines on the basis of A/D indicator (Accumulation/Distribution). When A/D indicator breaks a trend line, the probability of the trend reversal is very high. This is a multitimeframe indicator which can display values from higher timeframes. Parameters Time-frame — Select a timeframe; zero is the current timeframe of the chart; Trend Line — Display lines on the chart; Apply to — Apply lines to close the candle's highest/lowest value; Width line — Width of the line; Style
FREE
Beacon
Pavel Shutovskiy
5 (2)
The indicator determines overbought/oversold zones on various timeframes. Arrows show market trend in various time sessions: if the market leaves the overbought zone, the arrow will indicate an ascending trend (arrow up), if the market leaves the oversold zone, the arrow will indicate a descending trend (arrow down). Situation on the timeframe, where the indicator is located, is displayed in the lower right window. Information on the market location (overbought or oversold zone), as well as the
FREE
MA 2 Histogram
Pavel Shutovskiy
4.5 (2)
The indicator is based on two Moving Averages. Its only difference from traditional indicators is that it is presented as a histogram. The histogram has four colors; each color represents a MA with its own period. In case of a descending trend, if a price is lower than a moving average, the indicator displays a value lower than the red zero level. In case of ascending trend, the indicator value is higher than the green zero level. Parameters: Period MA 1 - Period of the first moving average. MA
FREE
Fibo
Pavel Shutovskiy
5 (2)
The script sets Fibonacci levels on the chart using maximums and minimums visible on the chart. The script names Fibo with such timeframe on which it has been launched (Fibo D1 or Fibo M30, etc.), therefore preserving previously constructed levels on different time charts. This instrument will be useful for those who start studying Fibonacci levels and those who need to form these levels in a speedy fashion. The script does not have additional settings. Fibonacci lines can be amended in standard
FREE
Trend following
Pavel Shutovskiy
4.5 (2)
The EA in the form of histogram displays up and down trends. This tool is recommended to be used as a filter. Its readings will help to detect beginning, end, and continuation of a trend. This additional tool will suit any trading system. Parameters Period — indicator period; Bars — number of bars on the history.
FREE
Maps
Pavel Shutovskiy
4.75 (4)
The indicator displays on the chart a map, on which markers show the current trading session, as well as shows a text. The indicator provides two types of background display: white and black. The indicator is displayed as the background and does not hinder tracking the current market situation. Parameters: GMT -  the time difference of the terminal and GMT. Background - selection of background - black or white.
FREE
Any chart has patterns of consolidation which are also called accumulation patterns. These are sections where the market has been on the same price level during significant amount of time, and thus it was accumulating positions. After such accumulation, positions are distributing, and the market passes from flat into trend. The Consolidation Levels indicator is a professional tool which identifies these sections and builds levels according to the price of the market at the moment of consolidatio
ATR Pivot
Pavel Shutovskiy
The indicator calculates the levels by ATR daily range using the equations: 1AR = Open + ATR -1AS = Open - ATR AR 1/2 = Open + (ATR / 2) AS -1/2 = Open - (ATR / 2) AR 1/4 = Open + (ATR / 4) AS -1/4 = Open - (ATR / 4) AR 3/4 = Open + ((ATR*3) / 4) AS -3/4 = Open - ((ATR*3) / 4) AR 2 = Open + (ATR*2) AS -2 = Open - (ATR*2) Parameters Period ATR - ATR period Shift time - shift by time for Open Color opening of day - Open line color Color 1AR, -1AS - 1AR, -1AS line color Color AR 1/2, AS -1/2 - AR 1
Max Min Levels
Pavel Shutovskiy
The indicator makes levels according to local maximums and minimums of a week, a month, or a year. Parameters: Week number - number of weeks for lines display Week level color - Week line color Month number - number of months for lines display Month level color - Month line color Year number - number of years for lines display Year level color - Year line color Width line - Width of lines Style line - Style of lines
AO AC Signal
Pavel Shutovskiy
The indicator displays signals of different indicators (which can be selected in parameters) on a chart when zero level is crossed. AO, AC or AO+AC if signals of two indicators coincide. The indicator shows an Alert message (pop-up window) when a signal appears. Parameters: Indicators - Selection of the indicator AO, AC, AO+AC. Bars - Number of bars in history for display of signals. Alert - Pop-up window in case of a signal.
Beginning
Pavel Shutovskiy
The indicator builds levels from beginning of a week or a month, or according to local Highs and Lows. These levels are meant for detection of strong support and resistance levels on a chart. Most big players of the market are guided by particularly these data: opening of the week or opening of the month. Breakout of one or several Highs and price consolidation on these levels suggest that market intends to grow. Breakout of Lows and price consolidation bears evidence of market's intention to mo
F trend
Pavel Shutovskiy
The indicator is designed for scalping fans, it gives signals of an average of ten pips. The indicator is based on mathematical calculation, it determines the average range of the price channel, which is generally formed at the time of accumulation of positions. Once the price moves beyond its borders, a signal is generated in the form of an arrow. The indicator has a minimum of settings: the period for which you need to calculate, and the frequency of signals (the signal frequency is determined
Woltec
Pavel Shutovskiy
4 (1)
The indicator has been developed for scalping. The indicator is based on a mathematical calculation that determines the percent range of the price channel, which is generally formed at the time of the accumulation of positions. Once the price moves beyond its borders, a signal is generated in the form of dots. The indicator has a minimum of settings - the frequency of signals. Smaller values produce more signals. Parameters: Multiplier - the frequency of signals (with lower values signals are m
Jaguar tac
Pavel Shutovskiy
The indicator uses the Envelopes channel in its calculations, which allows working with dynamic support and resistance levels. It also considers the direction and strength of the trend, as well as the mathematical calculation that determines the percent range of the price channel, which is generally formed at the time of the accumulation of positions. It first generates a preliminary signal in the form of a round arrow. Then it is necessary to wait for a normal arrow and enter the market only af
ADX trend
Pavel Shutovskiy
This indicator displays the signals of the ADX indicator (Average Directional Movement Index) as points on the chart. This facilitates the visual identification of signals. The indicator also features alerts (pop-up message boxes) and sending signals to e-mail. Parameters Period - averaging period. Apply to - price used for calculations: Close, Open, High, Low, Median (high+low)/2, Typical (high+low+close)/3, Weighted Close (high+low+close+close)/4. Alert - enable/disable alerts. EMail - enable
ADX arrow N
Pavel Shutovskiy
ADX arrow 该指标将 ADX indicator (平均方向移动指数)的信号显示为图表上的点。 这便于信号的视觉识别。 该指示器还具有警报(弹出消息框)和向电子邮件发送信号。          参数 Period   -平均周期。 Apply to -用于计算的价格:关闭,开放,高,低,中位数(高+低)/2,典型(高+低+关闭)/3,加权关闭(高+低+关闭+关闭)/4。 Alert   -启用/禁用警报。 EMail   -启用/禁用向电子邮件发送信号。 Push -启用/禁用发送信号推送 Period  - averaging period. Apply to  - price used for calculations: Close, Open, High, Low, Median (high+low)/2, Typical (high+low+close)/3, Weighted Close (high+low+close+close)/4. Alert  - enable/disable alerts. EMail  - enable/disable sen
ATR Pivots
Pavel Shutovskiy
The indicator calculates intraday levels based on the average daily price range, builds support and resistance levels that may be reversal. Parameters Period ATR - period of the ATR indicator Shift time - time offset for the opening of the day Color opening of day - color of the opening line of the day Color 1AR, -1AS - line color 1AR, -1AS Color AR 1/2, AS -1/2 - line color AR 1/2, AS Color AR 1/4, AS -1/4 - line color AR 1/4, AS -1/4 Color AR 3/4, AS -3/4 - line color AR 3/4, AS -3/4 Color
筛选:
Andrzej Swietochowski
133
Andrzej Swietochowski 2021.03.08 12:52 
 

It's wasted money. The signal keeps shifting. This program cannot be trusted. The program repaints its signals. Don't buy it - it's a waste of time and a waste of your money. I haven't seen anything worse. The seller should refund your money for this. You can't build a strategy because no one knows when the signal was in the past, and these past signals shown - are repainted, changed. He even repaints 1 indicator.

Dine Scalpers
51
Dine Scalpers 2019.02.07 21:48 
 

Amazing Service - I was having trouble setting it up and Pavel very quickly sent me 3 different "set" files to load into the indicator and it is doing what it's supposed to do. Definitely worth it.

UPDATE: Having a little concern at the moment since after testing this product much more intently. If you are okay with repainting programs, then this is for you. I am currently using it in the most basic of forms and just wanted to know when the Main Line crosses the Signal Line when above 80% or below 20% for a fast and medium setting in the same time frame. This is a definitive point in time when using a candle closed condition. However, after it shows this, it continues to move the "Suggestion" arrow as the chart "flat lines" and there is not much movement either way, removes the suggested trade arrow if it begins reversing on you, and then also moves the arrow down to the optimal point when it does finally go up in the direction originally shown.

In Conclusion, if you are sitting there at your charts, it typically will provide an alert at the correct time but, unfortunately it tries to make things look prettier than they really are by repainting to the perfect spot. I have put in a request to see if this failing feature of so many programs that can absolutely mess up a strategy can be deleted and based on that, we will look into adjust the star rating.

Dine

回复评论