Strategy Builder

5

Strategy Builder


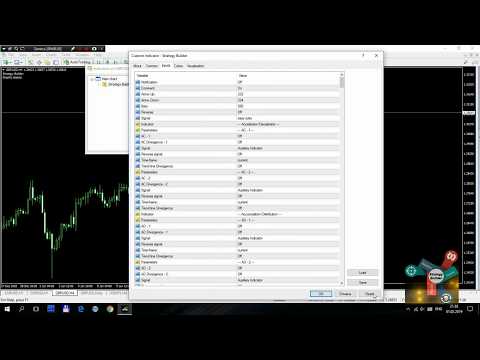
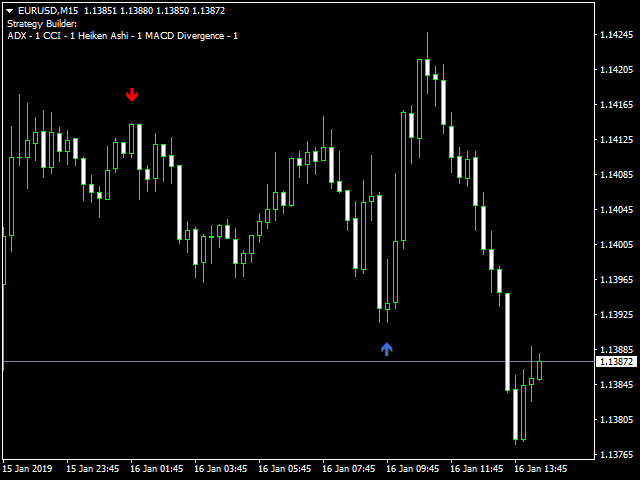
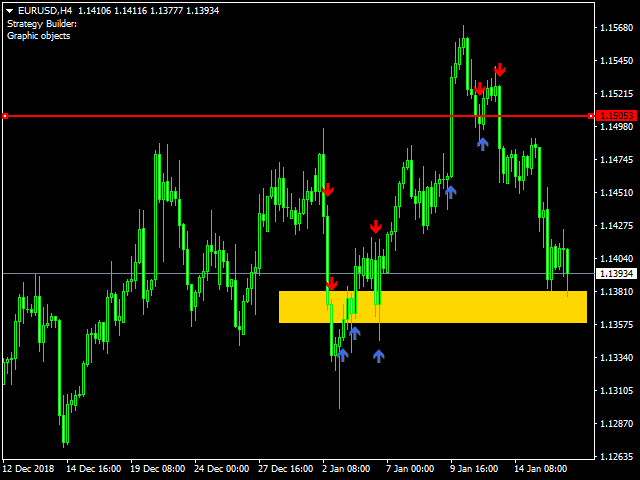
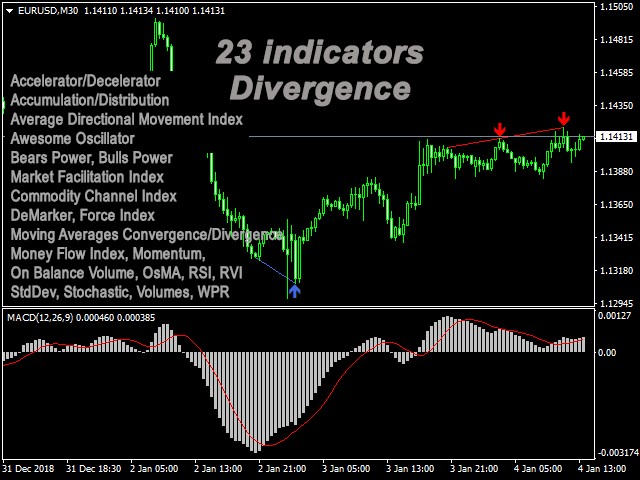
전략 지표 작성기를 만들 수 있습 고전과 개별적인 전략을 로드하지 않고 차트의 큰 숫자를 표시 및 추적 없이 많은 서로 다른 지표를 식별하는 진실한 신호입니다. 전략이트 빌더는 신호 형식의 화살표 30 표준 지표 23 표를 보여주는 클래식하고 숨겨진 차이에서 보내는 신호를 수신하는 피보나치 수준,수평한,트렌드 라인과 사각형입니다. 의 도움으로 이 지시할 수 있습에서 신호를 수신기에서뿐만 아니라,여러 가지 지표를 선택하여 주 및 보조지표로 필터에 설정합니다.


표시기 유형:추세,발진기,채널,레벨,다중 기간,볼륨.


표시기가 중복되므로 판독 값을 얻을 수 있습니다(예:다른 시간대의 RSI)13 개의 표시기에서 선(교차)을 교차 할 때 신호를 수신 할 수 있습니다.

지표:

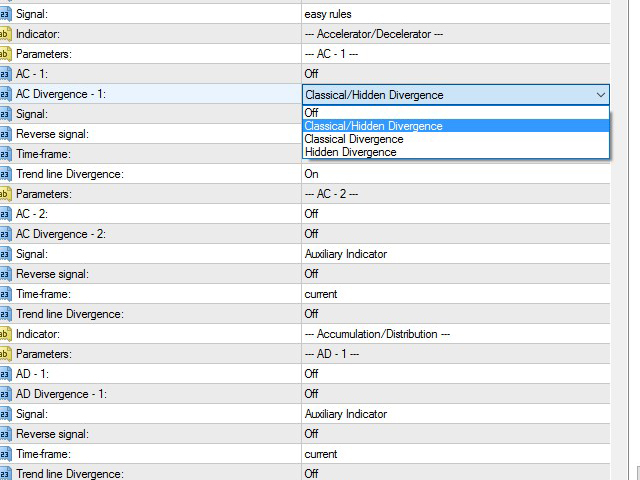
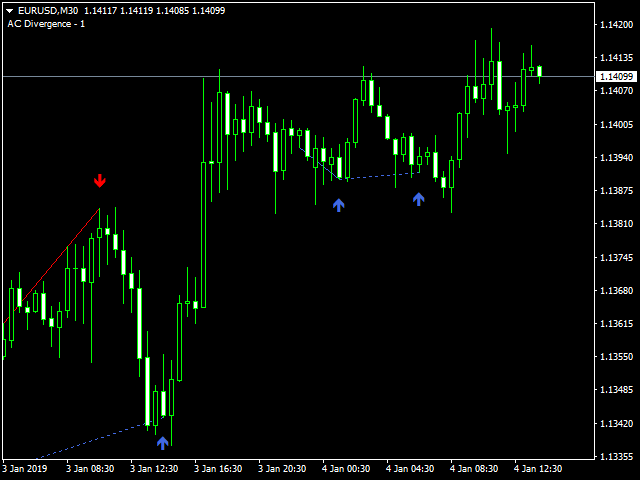
  • AC - Accelerator/Decelerator + Divergence
  • AD - Accumulation/Distribution + Divergence
  • ADX - Average Directional Movement Index + Divergence
  • Alligator
  • AO - Awesome Oscillator + Divergence
  • ATR - Average True Range + Divergence + Crossing
  • Bands - Bollinger Bands® 
  • Bears Power + Divergence
  • Bulls Power + Divergence
  • BWMFI - Market Facilitation Index - Divergence
  • CCI - Commodity Channel Index + Divergence + Crossing
  • DeMarker + Divergence + Crossing
  • Envelopes + Crossing
  • Force Index + Divergence + Crossing
  • Fractals
  • Gator Divergence
  • Heiken Ashi
  • Ichimoku - Ichimoku Kinko Hyo
  • MA - Moving Average + Crossing
  • MACD - Moving Averages Convergence/Divergence + Divergence
  • MFI - Money Flow Index + Divergence + Crossing
  • Momentum + Divergence + Crossing
  • OBV - On Balance Volume + Divergence
  • OsMA - Moving Average of Oscillator + Divergence
  • RSI - Relative Strength Index + Divergence + Crossing
  • RVI - Relative Vigor Index + Divergence + Crossing
  • SAR - Parabolic Stop and Reverse system
  • StdDev - Standard Deviation + Divergence + Crossing
  • Stochastic Oscillator + Divergence + Crossing
  • Volumes + Divergence
  • WPR - Larry Williams' Percent Range + Divergence + Crossing
  • ZigZag
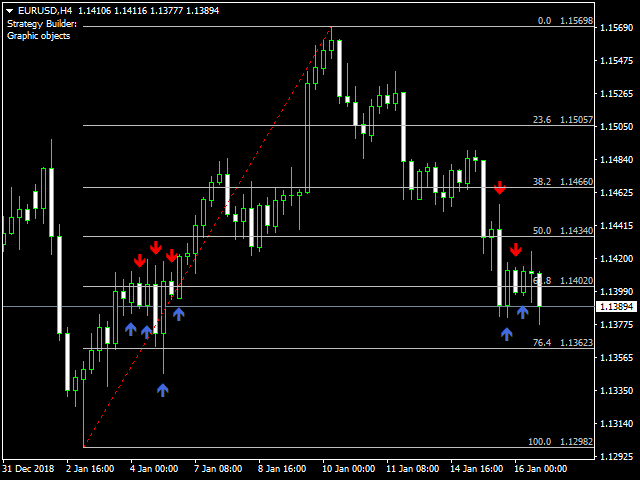
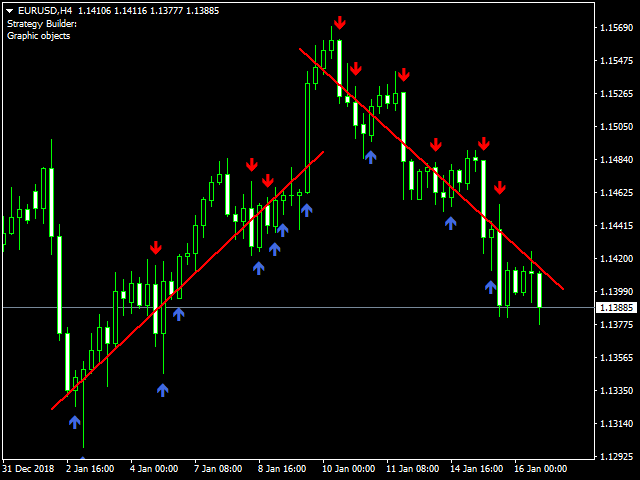
  • Graphic objects (horizontal, trend lines, rectangle, Fibonacci levels)

매개 변수:

  • Notification -알림 사용
  • Comment - 포함 된 지표에 대한 주석을 표시하려면
  • Arrow Up - 신호 업을위한 글꼴 문자 윙딩
  • Arrow Down - 신호 다운을위한 글꼴 문자 윙딩
  • Bars - 표시기의 신호를 표시하는 히스토리의 막대 수
  • Reverse - 모든 지표의 역방향 신호
  • Signal - 의 방법을 선택하고 신호 형성할 때 사용하여 여러 지시자:엄격한 규칙 신호이 형성될 때 여러 가지 표시기 신호에 일치 중 하나는 바입니다. 쉬운 규칙-신호는 표시기 필터 및 주요 표시기의 규칙에 따라 형성됩니다

모든 매개 변수는 토론에 게시됩니다.

호출이 표시 EA 에 의해 제한된 수의 iCustom 입력 매개변수 신호를 수신:표시 설정해야 합니다 차트에서 신호를 리셉션을 사용 가능 GlobalVariableGet 기능

ea 에서 신호를 수신하는 함수의 예:

int IndicatorSignal(){
   if(GlobalVariableGet("Strategy Builder " + _Symbol + " " + (string)_Period) == 1.0) return 0; // sinal UP

   if(GlobalVariableGet("Strategy Builder " + _Symbol + " " + (string)_Period) == 2.0) return 1; // signal DOWN

   return -1;
}


리뷰 2
Dine Scalpers
51
Dine Scalpers 2019.02.07 21:48 
 

Amazing Service - I was having trouble setting it up and Pavel very quickly sent me 3 different "set" files to load into the indicator and it is doing what it's supposed to do. Definitely worth it.

UPDATE: Having a little concern at the moment since after testing this product much more intently. If you are okay with repainting programs, then this is for you. I am currently using it in the most basic of forms and just wanted to know when the Main Line crosses the Signal Line when above 80% or below 20% for a fast and medium setting in the same time frame. This is a definitive point in time when using a candle closed condition. However, after it shows this, it continues to move the "Suggestion" arrow as the chart "flat lines" and there is not much movement either way, removes the suggested trade arrow if it begins reversing on you, and then also moves the arrow down to the optimal point when it does finally go up in the direction originally shown.

In Conclusion, if you are sitting there at your charts, it typically will provide an alert at the correct time but, unfortunately it tries to make things look prettier than they really are by repainting to the perfect spot. I have put in a request to see if this failing feature of so many programs that can absolutely mess up a strategy can be deleted and based on that, we will look into adjust the star rating.

Dine

추천 제품
PZ Mean Reversion MT4
PZ TRADING SLU
3 (4)
평균 회귀 거래에 대한 전문적이고 정량적인 접근 방식을 구현하는 고유한 지표입니다. 이는 가격이 예측 가능하고 측정 가능한 방식으로 평균으로 전환되고 반환된다는 사실을 이용하여 비정량적 거래 전략을 훨씬 능가하는 명확한 진입 및 퇴장 규칙을 허용합니다. [ Installation Guide | Update Guide | Troubleshooting | FAQ | All Products ] 명확한 거래 신호 놀랍도록 쉬운 거래 사용자 정의 가능한 색상 및 크기 성능 통계 구현 대부분의 거래 전략을 능가합니다. 적절한 SL 및 TP 레벨을 표시합니다. 이메일/음향/시각 알림을 구현합니다. 작동 원리 이 지표는 더 높은 기간에서 완전히 사용자 정의 가능한 이동 평균 주변의 표준 편차를 측정하고 추세 추종 접근 방식을 사용하여 정확하게 거래를 찾습니다. 거래는 현재 차트의 가격 동작을 살펴보고 선택한 더 높은 기간에서 계산된 평균 가격대로 가격이 돌아오면 닫힙니다. 코딩 방식 때문에 지
"다이나믹 스캘핑 오실레이터"는 MT4를 위한 고급 맞춤형 암호화폐/외환 지표이자 효율적인 트레이딩 도구입니다! - 차세대 오실레이터 - 사용 방법은 그림을 참조하세요. - 다이나믹 스캘핑 오실레이터는 적응형 과매도/과매수 영역을 제공합니다. - 오실레이터는 동적인 과매도/과매수 영역에서 정확한 진입 시점을 찾는 보조 도구입니다. - 과매도 값: 녹색선 아래, 과매수 값: 주황색선 위. - 이 지표는 가격 변동 패턴과도 결합하기 좋습니다. - 일반 오실레이터보다 훨씬 정확합니다. 적합한 시간대: M30, H1, H4, D1, W1. - PC 및 모바일 알림 기능 제공. .......................................................................... 여기를 클릭하여 고품질 트레이딩 로봇과 지표를 확인하세요! MQL5 웹사이트에서만 제공되는 오리지널 제품입니다.
VR Cub
Vladimir Pastushak
VR Cub 은 고품질 진입점을 얻는 지표입니다. 이 지표는 수학적 계산을 용이하게 하고 포지션 진입점 검색을 단순화하기 위해 개발되었습니다. 지표가 작성된 거래 전략은 수년 동안 그 효율성을 입증해 왔습니다. 거래 전략의 단순성은 초보 거래자라도 성공적으로 거래할 수 있다는 큰 장점입니다. VR Cub은 포지션 개시 지점과 이익 실현 및 손절매 목표 수준을 계산하여 효율성과 사용 편의성을 크게 높입니다. 간단한 거래 규칙을 이해하려면 아래 전략을 사용한 거래 스크린샷을 살펴보세요. 설정, 세트 파일, 데모 버전, 지침, 문제 해결 등은 다음에서 얻을 수 있습니다. [블로그] 다음에서 리뷰를 읽거나 작성할 수 있습니다. [링크] 버전 [MetaTrader 5] 진입점 계산 규칙 포지션 개설 진입점을 계산하려면 VR Cub 도구를 마지막 최고점에서 마지막 최저점까지 늘려야 합니다. 첫 번째 지점이 두 번째 지점보다 빠른 경우, 거래자는 막대가 중간선 위에서 마감될 때까지 기다립니다
SMC Venom Model BPR 지표는 Smart Money(SMC) 개념 내에서 일하는 트레이더를 위한 전문 도구입니다. 가격 차트에서 두 가지 주요 패턴을 자동으로 식별합니다. FVG (공정 가치 갭)는 3개의 캔들의 조합으로, 첫 번째와 세 번째 캔들 사이에 갭이 있습니다. 이는 볼륨 지원이 없는 레벨 사이에 구역을 형성하여 종종 가격 수정으로 이어집니다. BPR (균형 가격 범위)은 두 개의 FVG 패턴의 조합으로, "브리지"를 형성합니다. 이는 가격이 낮은 볼륨 활동으로 움직일 때 브레이크아웃과 레벨로의 복귀 구역으로, 캔들 사이에 갭을 생성합니다. 이러한 패턴은 거래자가 차트에서 거래량과 가격 역학을 분석하여 주요 지지/저항 수준, 돌파 구역 및 진입 지점을 식별하는 데 도움이 되며, 여기서 대형 시장 참여자와 일반 참여자 간의 상호 작용이 발생합니다. 이 지표는 사각형과 화살표 형태로 패턴을 시각화하며 유연한 경고 설정도 지원합니다. 주요 특징: 패턴 표시 모드:
EARLY REMINDER: The Starting price is 65 price will rise soon up to 365$ and then 750$ after first 10 copies of sales. Grab this offer now! Introduction Hello, traders! Welcome to the demonstration of the Forex Beast Indicator , a comprehensive tool designed to assist aspiring traders in navigating the complexities of the forex market. This indicator incorporates seven essential components to provide a well-rounded trading experience: Moving Averages Colored Zones Support and Resistance Levels
Super Reversal Pattern
Parfait Mujinga Ndalika
Super Reversal Pattern Indicator Unlock the power of advanced pattern recognition with our Super Reversal Pattern Indicator. Designed for traders seeking precision and reliability, this indicator identifies one of the most effective reversal patterns in technical analysis, offering a significant edge in your trading strategy. Key Features: Non-Repainting Accuracy: Enjoy the confidence of non-repainting technology. Once a Super Reversal Pattern is detected, it remains static, providing consiste
Binary Option Signal
Yaroslav Varankin
Indicator for binary options arrow is easy to use and does not require configuration works on all currency pairs, cryptocurrencies buy signal blue up arrow sell signal red down arrow tips do not trade during news and 15-30 minutes before their release, as the market is too volatile and there is a lot of noise it is worth entering trades one or two candles from the current period (recommended for 1 candle) timeframe up to m 15 recommended money management fixed lot or fixed percentage of the depo
SystemBinaryM1
Andrey Spiridonov
SystemBinaryM1 - a professional indicator for trading short-term binary options, is a complete, self-contained author's strategy for working in the binary options market. The unique algorithm for analyzing the foreign exchange market is based on the calculation of reference points on three different time periods M15, M5. M1. Thus, the indicator simultaneously analyzes the long-term, medium-term and short-term price behavior before issuing a signal. The indicator is set in the usual way and work
Signal From Level
Yaroslav Varankin
Binary Options Support Resistance Indicator This indicator is designed for binary options trading and effectively shows retracements from support and resistance levels. Signals appear on the current candle. A red arrow pointing downwards indicates a potential selling opportunity, while a blue arrow pointing upwards suggests buying opportunities. All that needs adjustment is the color of the signal arrows. It is recommended to use it on the M1-M5 timeframes as signals are frequent on these timef
First Dawn
Innovicient Limited
The First Dawn indicator uses a unique mechanism to search and plot signals. This keeps searching for signals, making it a great indicator for scaping and identification of changes in direction, swing trading and trend trading. The  First Dawn   helps you get early signals. The backtest gives the true picture of how the indicator works with real/demo accounts. Although this is a tiny indicator it is packed with advantageous settings that will help you whether you desire to: Snap the Peaks and
Angry
Maryna Shulzhenko
Angry is a trend indicator, it indicates well the points of the beginning of the trend and its completion or reversal. This tool scans the market looking for the correct entry. Against the background of insignificant fluctuations, it is possible to identify a trend and indicate its direction. It uses only price data and analytics to calculate entry points. Does not use auxiliary indicators. Angry captures moments of stable price movement direction. There are only three types of trend: Bullish
Indicator. "Indicator wave or Indicator Ma". Using 23 standard indicators and the author's algorithm, the levels of purchases (from 0 to +100) and sales (from 0 to -100) are calculated. Then, using the calculated levels, the "Wave Indicator" draws a wave with 21 moving averages. The wave number is equal to the averaging period of the calculated levels. Waves # 1 - 7 Fast Moving Averages Waves from No. 8 -14 moving averages Waves from No. 15-21 slow moving averages Looking at the figures drawn
"Scalping trading strategy" - the indicator was created for trading using the scalping system. "Scalping trading strategy" shows on the chart with an arrow where the price will go now. After the indicator draws an arrow, the price will go in the direction of the arrow by at least 20 points. This is enough for us to trade effectively. "Scalping trading strategy" does not redraw its signals. The indicator has many different modes of operation. It can draw an arrow both at the beginning of a new c
The new update makes this indicator a complete tool for studying, analyzing and operating probabilistic patterns. It includes: On-chart Multi-asset percentage monitor. Configurable martingales. Twenty-one pre-configured patterns , including Mhi patterns and C3. An advanced pattern editor to store up to 5 custom patterns. Backtest mode to test results with loss reports. Trend filter. Hit operational filter. Martingale Cycles option. Various types of strategies and alerts. Confluence between patte
Structural Trend Lines
Vincent Jose Proenca
STRUCTURAL TREND LINES - MT4 Indicator Simple indicator that automatically draws trend lines based on market structure. Features: - 3 degrees of structure detection (short, medium, long term) - Configurable swing strength for each degree - Single color per degree for clean visualization - Adjustable number of lines per degree - Customizable colors and line widths How it works: The indicator identifies swing highs and lows based on the strength parameter, then connects these points to create t
Stochastic BR
Antony Augustine
Stochastic BR allows you to recognize reversals professionally. The "Stochastic BR" is designed to recognize profitable counter trend patterns from your chart. Stochastic Indicator: This technical indicator was developed by George Lane more than 50 years ago. The reason why this indicator survived for so many years is because it continues to show consistent signals even in these current times. The Stochastic indicator is a momentum indicator that shows you how strong or weak the current trend i
This indicator displays the ZigZag Pointer Fibonacci Expansion Triangle movements timeframes only M1-W1. Parameters InDepth: Displays the Depth movements. InDeviation: Displays the Deviation movements. InBackstep: Displays the Backstep movements. Fibonacci Expansion: Displays the Fibonacci Expansion movements. Fibonacci Expansion true.(false) Triangle: Displays the Triangle movements. Triangle true.(false) How to understand the status: If the Triangle is green, trend is up. If the Triangle is r
KT Horizontal Lines MT4
KEENBASE SOFTWARE SOLUTIONS
MetaTrader에서 여러 개의   수평선을   그린 후 각 수평선의 가격을 추적하는 것은 번거로운 작업이 될 수 있습니다. 이 인디케이터는 가격 알림 설정, 지지/저항선 표시 및 기타 수동 목적을 위해 동일한 간격으로 여러 수평선을 자동으로 그려줍니다. 이 인디케이터는 빠른 매수 및 매도를 통해 수익을 얻고자 하는 초보 외환 트레이더에게 적합합니다. 수평선은 시장이 추세를 따르거나 횡보 중일 때 거래 진입 가능성이 있는 구간을 찾는 데 유용합니다. 기능 입력 설정에 따라 여러 수평선을 즉시 자동으로 표시합니다. 여러 수평선을 쉽게 구분할 수 있도록 생동감 있는 색상 테마 제공. 여러 거래 세션의 가격 범위를 추적하는 데 유용한 필수 도구입니다. 가격이 수평선에 도달하면 알림을 전송합니다. 지나친 반복 알림을 방지하기 위해 알림 간격 설정 가능. 완전한 사용자 맞춤 설정 지원. 설명 이 인디케이터는 입력 설정에서 지정된 값과 지시에 따라 수평선을 표시합니다. 가격이 수평선에서
RSI Speed mp
DMITRII GRIDASOV
MT4용 Crypto_Forex 지표 "RSI SPEED" - 훌륭한 예측 도구, 재도색 불필요 - 이 지표는 물리학 방정식을 기반으로 계산됩니다. RSI SPEED는 RSI 자체의 1차 미분값입니다. - RSI SPEED는 주요 추세 방향으로 스캘핑 진입에 유용합니다. - HTF MA(그림 참조)와 같은 적절한 추세 지표와 함께 사용하세요. - RSI SPEED 지표는 RSI 자체의 방향이 얼마나 빨리 변하는지를 보여주며, 매우 민감합니다. - 모멘텀 거래 전략에는 RSI SPEED 지표 사용을 권장합니다. RSI SPEED 지표 값이 0보다 작으면 가격 모멘텀이 하락하고, 0보다 크면 가격 모멘텀이 상승합니다. - 모바일 및 PC 알림 기능이 내장되어 있습니다. 여기를 클릭하여 고품질 트레이딩 로봇과 지표를 확인하세요! 본 제품은 MQL5 웹사이트에서만 제공되는 정품입니다.
Phase Analytics Pro: Advanced Cyclic Market Analyzer Phase Analytics Pro is a sophisticated technical tool designed for traders who prioritize mathematical precision over lag-heavy traditional indicators. Based on the principles of digital signal processing, this indicator decomposes price action into phase and quadrature components to identify the dominant market cycle. How it works: The algorithm calculates the instantaneous phase of the market, allowing it to distinguish between trending and
This is a new strategy for SUPPLY DEMAND areas It is based on a calculation using the tick volume to detect the big price action in market for both bear /bull actions this smart volume action candles are used to determine the supply and demand areas prices in between main supply and demand lines indicate sideway market  up arrows will be shown when prices moves above the main supply and the secondary supply lines Down arrows will be shown when prices moves below the main demand and the secondary
Alpha Trend sign has been a very popular trading tool in our company for a long time. It can verify our trading system and clearly indicate trading signals, and the signals will not drift. Main functions: Based on the market display of active areas, indicators can be used to intuitively determine whether the current market trend belongs to a trend market or a volatile market. And enter the market according to the indicator arrows, with green arrows indicating buy and red arrows indicating se
FIBO Trend PRO mt4
Evgenii Aksenov
5 (6)
The indicator allows you to instantly determine the current trend by color and FIBO levels. Higher Timeframe the panel shows the current trend of higher periods, helping to determine the strength of the trend Trade according to the trend when changing the color of candles or trade against the trend when the price hit the extreme levels of the   FIBO Trend PRO  indicator     Advantages of the FIBO Trend PRO Indicator never repaint and does not change their values Very easy to use and intuitive
Royal Dutch Skunk
Sayan Vandenhout
ROYAL DUTCH SKUNK USES THE TREND WAVE INDICATOR AND IT CAN IDENTIFY THE BEGINNING AND THE END OF A NEW WAVE TREND MOVEMENT. AS AN OSCILLATOR, THE INDICATOR IDENTIFIES THE OVERBOUGHT AND OVERSOLD ZONES. IT WORKS GREAT TO CATCH THE SHORT TERM PRICE REVERSALS AND USES A MARTINGALE STRATEGY TO CLOSE ALL TRADES IN PROFIT. USE DEFAULT SETTINGS ON H1 OR HIGHER TIME FRAME ON ANY PAIR FOR MORE ACCURATE TRADES WHY THIS EA : Smart entries calculated by 6 great strategies The EA can be run on even a $20000
NO REPAINT ADVANCED CHART PATTERN INDICATOR By definition, a price ( chart)  pattern is a recognizable configuration of price movement that is identified using a series of  trendlines  and/or curves. When a price pattern signals a change in trend direction, it is known as a reversal pattern; a continuation pattern occurs when the trend continues in its existing direction following a brief pause. Advanced Chart Pattern Tracker is designed to find the MOST ACCURATE patterns. A special script is a
SuperTrend Alerts
Libertas LLC
3 (4)
SuperTrend Alerts adds alerts to the widely popular SuperTrend indicator. As the name suggests, SuperTrend is a trending indicator which works best in trendy (not choppy) markets. SuperTrend is extremely popular for intraday and daily trading, and can be used on any timeframe. Place a call when the price closes above the SuperTrend line, and place a put when the price closes below the SuperTrend line. These crossovers are highlighted by non-repainting up/down arrows. Alerts Email, message and s
Master head and shoulders patterns for better trading decisions A head and shoulders pattern is a chart formation that resembles a baseline with three peaks, the outside two are close in height and the middle is highest. It predicts a bullish-to-bearish trend reversal and is believed to be one of the most reliable trend reversal patterns. It is one of several top patterns that signal, with varying degrees of accuracy, that a trend is nearing its end.  [ Installation Guide | Update Guide | Troubl
Auto Fibo Pro m
DMITRII GRIDASOV
"Auto FIBO Pro" Crypto_Forex 지표 - 거래에 유용한 보조 도구입니다! - 지표는 자동으로 Fibo 수준과 로컬 추세선(빨간색)을 계산하여 차트에 배치합니다. - Fibonacci 수준은 가격이 반전될 수 있는 주요 영역을 나타냅니다. - 가장 중요한 수준은 23.6%, 38.2%, 50%, 61.8%입니다. - 역전 스캘핑이나 존 그리드 거래에 사용할 수 있습니다. - Auto FIBO Pro 지표를 사용하여 현재 시스템을 개선할 수 있는 기회도 많습니다. - Info Spread Swap Display가 있습니다. 현재 Spread와 Swap이 부착된 외환 쌍을 표시합니다. - 디스플레이에는 계정 잔액, 자본 및 마진도 표시됩니다. - 차트의 어느 모서리에서나 Info Spread Swap Display를 찾을 수 있습니다. 0 - 왼쪽 상단 모서리, 1 - 오른쪽 상단, 2 - 왼쪽 하단, 3 - 오른쪽 하단. 여기를 클릭하여 고품질 트레이딩 로봇과
캔들의 종가를 예측하는 지표입니다. 지표는 주로 D1 차트에서 사용하기 위한 것이. 이 지표는 전통적인 외환 거래와 바이너리 옵션 거래 모두에 적합합니다. 지표는 독립형 거래 시스템으로 사용하거나 기존 거래 시스템에 추가로 사용할 수 있습니다. 이 표시기는 현재 양초를 분석하여 양초 본체 내부의 특정 강도 요인과 이전 양초의 매개변수를 계산합니다. 따라서 지표는 시장 움직임의 추가 방향과 현재 양초의 종가를 예측합니다. 이 방법 덕분에 지표는 단기 및 중장기 거래 모두에 적합합니다. 지표를 사용하면 시장 상황을 분석하는 동안 지표가 생성할 잠재적 신호의 수를 설정할 수 있습니다. 표시기 설정에는 이를 위한 특별한 매개변수가 있습니다. 또한 인디케이터는 새로운 신호에 대해 차트의 메시지 형태, 이메일 및 PUSH 알림 형태로 알릴 수 있습니다. 구매 후 저에게 꼭 써주세요! 나는 당신에게 지표와 거래에 대한 나의 추천을 줄 것입니다! 또한 보너스를 받으세요!
PZ Trend Trading
PZ TRADING SLU
4.8 (5)
Capture every opportunity: your go-to indicator for profitable trend trading Trend Trading is an indicator designed to profit as much as possible from trends taking place in the market, by timing pullbacks and breakouts. It finds trading opportunities by analyzing what the price is doing during established trends. [ Installation Guide | Update Guide | Troubleshooting | FAQ | All Products ] Trade financial markets with confidence and efficiency Profit from established trends without getting whip
이 제품의 구매자들이 또한 구매함
Gann Made Easy
Oleg Rodin
4.83 (155)
Gann Made Easy 는 mr.의 이론을 사용하여 최고의 거래 원칙을 기반으로 하는 전문적이고 사용하기 쉬운 Forex 거래 시스템입니다. W.D. 간. 이 표시기는 Stop Loss 및 Take Profit Levels를 포함하여 정확한 BUY 및 SELL 신호를 제공합니다. PUSH 알림을 사용하여 이동 중에도 거래할 수 있습니다. 거래 팁, 보너스, GANN MADE EA를 무료로 받으시려면 구매 후 저에게 연락주세요! 아마도 Gann 거래 방법에 대해 이미 여러 번 들었을 것입니다. 일반적으로 Gann의 이론은 초보자 거래자뿐만 아니라 이미 거래 경험이 있는 사람들에게도 매우 복잡한 것입니다. Gann의 거래 방식은 이론적으로 적용하기 쉽지 않기 때문입니다. 나는 그 지식을 연마하고 Forex 지표에 최고의 원칙을 적용하기 위해 몇 년을 보냈습니다. 표시기는 적용하기가 매우 쉽습니다. 차트에 첨부하고 간단한 거래 권장 사항을 따르기만 하면 됩니다. 지표는 지속적으로 시장
El indicador "MR BEAST ALERTAS DE LIQUIDEZ" es una herramienta avanzada diseñada para proporcionar señales y alertas sobre la liquidez del mercado basándose en una serie de indicadores técnicos y análisis de tendencias. Ideal para traders que buscan oportunidades de trading en función de la dinámica de precios y los niveles de volatilidad, este indicador ofrece una visualización clara y detallada en la ventana del gráfico de MetaTrader. Características Principales: Canal ATR Adaptativo: Calcula
M1 Sniper
Oleg Rodin
5 (19)
M1 SNIPER 는 사용하기 쉬운 거래 지표 시스템입니다. M1 시간대에 맞춰 설계된 화살표 지표입니다. 이 지표는 M1 시간대 스캘핑을 위한 단독 시스템으로 사용할 수 있으며, 기존 거래 시스템의 일부로도 사용할 수 있습니다. 이 거래 시스템은 M1 시간대 거래용으로 특별히 설계되었지만, 다른 시간대에도 사용할 수 있습니다. 원래는 XAUUSD와 BTCUSD 거래를 위해 이 방법을 설계했지만, 다른 시장 거래에도 유용하다는 것을 알게 되었습니다. 이 지표의 신호는 추세 방향과 반대로 거래될 수 있습니다. 저는 지표의 신호를 활용하여 양방향으로 거래할 수 있도록 돕는 특별한 거래 기법을 알려드립니다. 이 방법은 특별한 동적 지지선과 저항선 가격 영역을 활용하는 것을 기반으로 합니다. 구매하시면 M1 SNIPER 화살표 지표를 바로 다운로드하실 수 있습니다. 또한, 아래 스크린샷에 표시된 Apollo Dynamic SR 지표는 M1 SNIPER 도구를 사용하는 모든 사용자에게 무료로
RFI levels PRO
Roman Podpora
5 (1)
이 지표는 추세 반전 지점과 가격 반등 영역을 정확하게 보여줍니다.       주요 투자자들   . 새로운 트렌드가 형성되는 곳을 파악하고 최대한 정확하게 의사결정을 내리며 모든 거래를 완벽하게 통제합니다. TREND LINES PRO   지표와 함께 사용할 때 최대의 잠재력을 발휘합니다.  VERSION MT5 지표가 보여주는 내용: 새로운 추세의 시작 시 활성화되는 반전 구조 및 반전 수준. 최소한의 위험 대비 수익률을 갖는 이익 실현   (TAKE PROFIT)   및   손절매(STOP LOSS)   레벨 표시       RR 1:2   . 지능형 손실 감소 로직이 적용된 손절매 기능. 지정된 지표에서 두 가지 추세 유형에 대한 반전 패턴을 표시합니다. 지표: 트렌드를 따라   트렌드 라인 프로   (글로벌 트렌드 변화) 트렌드 프로   (빠른 트렌드 변화) 간단하고 효과적입니다       스캐너       실시간 추세 (신규). 다중 시간 프레임 도구 필터링. 표시하다  
PRO Renko System
Oleg Rodin
5 (30)
PRO Renko System 은 RENKO 차트 거래를 위해 특별히 고안된 매우 정확한 거래 시스템입니다. 이것은 다양한 거래 상품에 적용될 수있는 보편적 인 시스템입니다. 체계는 효과적으로 당신에게 정확한 반전 신호에 접근을 주는 소위 시장 소음을 중화합니다. 이 표시기는 사용하기가 매우 쉽고 신호 생성을 담당하는 매개 변수가 하나만 있습니다. 당신은 쉽게 당신의 선택의 어떤 무역 계기에 공구를 적응시킬 수 있고 renko 막대기의 크기. 나는 항상 당신이 내 소프트웨어로 수익성있게 거래 할 수 있도록 추가 지원을 제공 할 준비가되어 있습니다! 나는 당신에게 행복하고 수익성있는 거래를 기원합니다! 구매 후 저에게 연락하십시오! 내 렌코 차트 생성기를 보내드립니다. 또한 내 개인 권장 사항 및 시스템의 다른 모듈을 무료로 공유 할 것입니다!
Scalper Inside PRO
Alexey Minkov
4.74 (69)
An exclusive indicator that utilizes an innovative algorithm to swiftly and accurately determine the market trend. The indicator automatically calculates opening, closing, and profit levels, providing detailed trading statistics. With these features, you can choose the most appropriate trading instrument for the current market conditions. Additionally, you can easily integrate your own arrow indicators into Scalper Inside Pro to quickly evaluate their statistics and profitability. Scalper Inside
Miraculous Indicator – Gann Square of Nine 기반 100% 비리페인트 Forex 및 바이너리 도구 이 영상은 Miraculous Indicator 를 소개합니다. 이 지표는 Forex 및 바이너리 옵션 트레이더를 위해 특별히 개발된 매우 정확하고 강력한 트레이딩 도구입니다. 이 지표가 독특한 이유는 전설적인 **Gann Square of Nine(Gann 9의 사각형)**과 **Gann's Law of Vibration(Gann 진동의 법칙)**에 기반을 두고 있기 때문입니다. 이는 현대 트레이딩에서 가장 정밀한 예측 도구 중 하나로 손꼽힙니다. Miraculous Indicator는 완전히 비리페인트(non-repaint) 됩니다. 즉, 캔들이 마감된 후에도 신호가 변경되거나 사라지지 않습니다. 보이는 것이 곧 결과입니다. 이는 트레이더가 자신감을 가지고 거래에 진입하고 청산할 수 있는 신뢰할 수 있고 일관된 기반을 제공합니다. 주요 특징: Gann
Trend Screener
STE S.S.COMPANY
4.79 (95)
트렌드 표시기, 트렌드 트레이딩 및 필터링을 위한 획기적인 고유 솔루션, 하나의 도구 안에 내장된 모든 중요한 트렌드 기능! Forex, 상품, 암호 화폐, 지수 및 주식과 같은 모든 기호/도구에 사용할 수 있는 100% 다시 칠하지 않는 다중 시간 프레임 및 다중 통화 표시기입니다. 기간 한정 특가: 지원 및 저항 스크리너 지표는 단 100달러에 평생 제공됩니다. (원래 가격 50 달러) (제안 연장) Trend Screener는 차트에 점이 있는 화살표 추세 신호를 제공하는 효율적인 지표 추세 추종 지표입니다. 추세 분석기 표시기에서 사용할 수 있는 기능: 1. 트렌드 스캐너. 2. 최대 이익 분석이 있는 추세선. 3. 추세 통화 강도 측정기. 4. 경고가 있는 추세 반전 점. 5. 경고가 있는 강력한 추세 점. 6. 추세 화살표 Trend Screener Indicator가 있는 일일 분석 예, 일일 신호 성능...등은 여기에서 찾을 수 있습니다.   여기를 클릭하십시오. L
Advanced Supply Demand
Bernhard Schweigert
4.91 (298)
현재 40% 할인! 초보자나 전문 트레이더를 위한 최고의 솔루션! 이 보조지표는 우리가 다수의 독창적 기능과 새로운 공식을 통합한 독특하고 고품질이며 저렴한 거래 도구입니다. 이 업데이트를 통해 이중 시간대를 표시할 수 있습니다. 더 높은 TF를 표시할 수 있을 뿐만 아니라 차트 TF와 더 높은 TF 모두를 표시할 수 있습니다: 중첩 영역 표시. 모든 Supply Demand 트레이더들이 좋아할 것입니다. :) 중요한 정보 공개 Advanced Supply Demand의 잠재력을 극대화하려면 다음을 방문하십시오. https://www.mql5.com/ko/blogs/post/720245   진입 또는 목표의 명확한 트리거 포인트를 정확히 찾아냄으로 해서 거래가 어떻게 개선될지 상상해 보십시오. 새로운 알고리즘을 기반으로 매수자와 매도자 간의 잠재적인 불균형을 훨씬 더 쉽게 분간할 수 있습니다. 왜냐하면 가장 강한 공급영역과 가장 강한 수요 영역과 과거에 어떻게 진행 되었는지를(이전
Trend Lines PRO
Roman Podpora
5 (1)
트렌드 라인즈 프로       이 지표는 시장이 실제로 어떤 방향으로 전환되는지 파악하는 데 도움이 됩니다. 실제 추세 반전 지점과 주요 시장 참여자들이 다시 진입하는 지점을 보여줍니다. 보시다시피       BOS 라인       복잡한 설정이나 불필요한 노이즈 없이 더 높은 시간대의 추세 변화와 주요 레벨을 확인할 수 있습니다. 신호는 차트에 다시 그려지지 않고 캔들이 마감된 후에도 계속 표시됩니다. VERSION MT 5   -   RFI LEVELS PRO   표시기   와 결합할 때 최대 잠재력을 발휘합니다. 지표가 보여주는 내용: 실제 변화       추세(BOS 라인) 한 번 신호가 나타나면 그 신호는 계속 유효합니다! 이는 신호를 발생시킨 후 변경될 수 있는 리페인팅 방식의 지표와 중요한 차이점입니다. 리페인팅 방식의 지표는 잠재적으로 자금 손실로 이어질 수 있습니다. 이제 더욱 높은 확률과 정확도로 시장에 진입할 수 있습니다. 또한 화살표가 나타난 후 목표가(익절)
Volatility Trend System - a trading system that gives signals for entries. The volatility system gives linear and point signals in the direction of the trend, as well as signals to exit it, without redrawing and delays. The trend indicator monitors the direction of the medium-term trend, shows the direction and its change. The signal indicator is based on changes in volatility and shows market entries. The indicator is equipped with several types of alerts. Can be applied to various trading ins
Precautions for subscribing to indicator This indicator only supports the computer version of MT4 Does not support MT5, mobile phones, tablets The indicator only shows the day's entry arrow The previous history arrow will not be displayed (Live broadcast is for demonstration) The indicator is a trading aid Is not a EA automatic trading No copy trading function The indicator only indicates the entry position No exit (target profit)  The entry stop loss point is set at 30-50 PIPS Or the front hi
현재 40% 할인 ! 초보자 또는 전문가 트레이더를 위한 최고의 솔루션! 이 대시보드 소프트웨어는 28개의 통화 쌍에서 작동합니다. 2가지 주요 지표(Advanced Currency Strength 28 및 Advanced Currency Impulse)를 기반으로 합니다. 전체 Forex 시장에 대한 훌륭한 개요를 제공합니다. 고급 통화 강도 값, 통화 이동 속도 및 모든(9) 시간대의 28 Forex 쌍에 대한 신호를 보여줍니다. 추세 및/또는 스캘핑 기회를 정확히 파악하기 위해 차트의 단일 지표를 사용하여 전체 시장을 볼 수 있을 때 거래가 어떻게 개선될지 상상해 보십시오! 잠재적인 거래를 식별하고 확인하면서 강력한 통화와 약한 통화를 더욱 쉽게 식별할 수 있도록 이 지표에 기능을 내장했습니다. 이 표시기는 통화의 강세 또는 약세가 증가 또는 감소하는지 여부와 모든 시간대에서 수행되는 방식을 그래픽으로 보여줍니다. 추가된 새로운 기능은 현재 시장 조건 변화에 적응하는
PairMaster Buy Sell Arrow Indicator for MT4 Trade Reversals Like a Pro — Catch Every Swing Point with Precision The PairMaster Buy Sell Arrow Indicator is a powerful MetaTrader 4 tool built to identify high-probability swing trading opportunities . Designed for traders who value accuracy, clarity, and simplicity, PairMaster detects key market turning points and plots intuitive buy and sell arrows directly on your chart. Key Features Accurate Swing Point Detection – Automatically identifies ma
Apollo Secret Trend
Oleg Rodin
5 (8)
Apollo Secret Trend는 모든 쌍과 시간대의 추세를 찾는 데 사용할 수 있는 전문적인 추세 지표입니다. 지표는 거래를 선호하는 쌍이나 기간에 관계없이 시장 동향을 감지하는 데 사용할 수 있는 주요 거래 지표가 될 수 있습니다. 표시기의 특수 매개변수를 사용하여 개인 거래 스타일에 맞게 신호를 조정할 수 있습니다. 표시기는 PUSH 알림을 포함한 모든 유형의 경고를 제공합니다. 표시기의 신호는 다시 칠하지 마십시오! 제공된 스크린샷에서 과매수/과매도 오실레이터 표시기와 함께 Apollo Secret Trend 표시기를 볼 수 있습니다. 이 표시기는 제가 절대적으로 무료로 제공합니다. 구매 후 두 번째 과매수 및 과매도 오실레이터 표시기를 무료로 받으려면 저에게 연락하십시오! 또한 시스템 사용 방법에 대한 지침도 제공합니다. 나는 또한 당신에게 큰 보너스를 공유 할 것입니다!
Dynamic Forex28 Navigator
Bernhard Schweigert
4.43 (7)
Dynamic Forex28 Navigator - 차세대 외환 거래 도구. 현재 49% 할인. Dynamic Forex28 Navigator는 오랫동안 인기 있는 지표의 진화형으로, 세 가지의 힘을 하나로 결합했습니다. 고급 통화 Strength28 지표(695개 리뷰) + 고급 통화 IMPULSE with ALERT(520개 리뷰) + CS28 콤보 신호(보너스). 지표에 대한 자세한 정보 https://www.mql5.com/en/blogs/post/758844 차세대 Strength 지표는 무엇을 제공합니까?  원래 지표에서 좋아했던 모든 것이 새로운 기능과 더 높은 정확도로 강화되었습니다. 주요 기능: 독점적인 통화 Strength 공식.  모든 시간대에 걸쳐 부드럽고 정확한 강도선. 추세와 정확한 진입을 식별하는 데 이상적입니다. 역동적인 시장 피보나치 수준(시장 피보나치).  이 지표에만 있는 고유한 기능. 가격 차트가 아닌 통화 강도에 피보나치가 적용됩니다.
Super Signal – Skyblade Edition 전문가용 노리페인트 / 노래그 트렌드 신호 시스템, 뛰어난 승률 제공 | MT4 / MT5용 1분, 5분, 15분과 같은 낮은 타임프레임에서 가장 좋은 성능을 보입니다. 핵심 기능: Super Signal – Skyblade Edition은 추세 매매를 위해 설계된 스마트 신호 시스템입니다. 이 시스템은 다중 필터 로직을 활용하여, 명확한 방향성과 실질적인 모멘텀이 수반된 고품질 추세만을 감지합니다. 이 시스템은 고점 또는 저점을 예측하지 않으며 , 다음 세 가지 조건이 모두 충족될 때만 신호를 발생시킵니다: 명확한 추세 방향 강화되는 모멘텀 건전한 변동성 구조 또한, 시장 세션 기반의 유동성 분석을 통해 신호의 신뢰성과 타이밍을 더욱 향상시킵니다. 신호 특성: 모든 화살표 신호는 100% 리페인트 없음 / 지연 없음 신호가 한 번 발생하면 고정되며, 깜빡이거나 사라지지 않음 차트 상의 시각적 화살표, 정보 패널, 팝업 알
Advanced Currency Strength28 Indicator
Bernhard Schweigert
4.91 (657)
현재 40% 할인 초보자 또는 전문가 트레이더를 위한 최고의 솔루션! 이 지표는 우리가 독점 기능과 새로운 공식을 통합했기 때문에 독특하고 고품질이며 저렴한 거래 도구입니다. 단 하나의 차트로 28 Forex 쌍의 통화 강도를 읽을 수 있습니다! 새로운 추세 또는 스캘핑 기회의 정확한 트리거 포인트를 정확히 찾아낼 수 있기 때문에 거래가 어떻게 개선될지 상상해 보십시오. 사용 설명서: 여기를 클릭  https://www.mql5.com/en/blogs/post/697384 그것이 첫 번째, 원본입니다! 쓸모없는 지망생 클론을 사지 마십시오. 더 스페셜  강력한 통화 모멘텀을 보여주는 하위 창의 화살표 GAP가 거래를 안내합니다! 기본 또는 호가 통화가 과매도/과매도 영역(외부 시장 피보나치 수준)에 있을 때 개별 차트의 기본 창에 경고 표시가 나타납니다. 통화 강도가 외부 범위에서 떨어질 때 풀백/반전 경고. 교차 패턴의 특별 경고 추세를 빠르게 볼 수 있는 다중 시간
Gold Scalper Super
Aleksandr Makarov
5 (2)
Gold Scalper Super is an easy-to-use trading system. The indicator can be used as a standalone scalping system on the M1 time frame, as well as part of your existing trading system. Bonus: when purchasing an indicator, Trend Arrow Super is provided free of charge, write to us after purchase. The indicator 100% does not repaint!!! If a signal appears, it does not disappear! Unlike indicators with redrawing, which lead to the loss of a deposit, because they can show a signal and then remove it.
Buy Sell Indicator MT5 – Smart Swing Signal Engine Buy Sell Indicator MT5 is a high-precision swing trading indicator designed to detect strong market turning points and provide clear Buy / Sell signals directly on the chart . It combines smart swing detection, momentum confirmation, and optimized calculation logic to deliver fast, accurate, and reliable signals for both scalpers and swing traders. Built for the MetaTrader 5 platform , this indicator is optimized for speed, stability, and real-
이 지표를 구매하면 제 프로페셔널 트레이드 매니저를 무료로 드립니다. 우선 이 거래 시스템이 리페인팅, 리드로잉 및 레이그 인디케이터가 아니라는 점을 강조하는 것이 중요합니다. 이는 수동 및 로봇 거래 모두에 이상적인 것으로 만듭니다. 온라인 강좌, 설명서 및 프리셋 다운로드. "스마트 트렌드 트레이딩 시스템 MT5"은 새로운 및 경험이 풍부한 트레이더를 위해 맞춤형으로 제작된 종합적인 거래 솔루션입니다. 10개 이상의 프리미엄 인디케이터를 결합하고 7개 이상의 견고한 거래 전략을 특징으로 하여 다양한 시장 조건에 대한 다목적 선택이 가능합니다. 트렌드 추종 전략: 효과적인 트렌드 추이를 타기 위한 정확한 진입 및 손절 관리를 제공합니다. 반전 전략: 잠재적인 트렌드 반전을 식별하여 트레이더가 범위 시장을 활용할 수 있게 합니다. 스캘핑 전략: 빠르고 정확한 데이 트레이딩 및 단기 거래를 위해 설계되었습니다. 안정성: 모든 인디케이터가 리페인팅, 리드로잉 및 레이그가 아니므로 신뢰
Atomic Analyst
Issam Kassas
5 (3)
우선적으로 언급할 점은이 거래 지표가 다시 그리지 않고 지연되지 않으며 이를 통해 수동 및 로봇 거래 모두에 이상적이라는 점입니다. 사용자 매뉴얼: 설정, 입력 및 전략. Atomic Analyst는 가격의 강도와 모멘텀을 활용하여 시장에서 더 나은 이점을 찾는 PA Price Action Indicator입니다. 고급 필터를 장착하여 잡음과 거짓 신호를 제거하고 거래 잠재력을 높이는 데 도움이 됩니다. 복잡한 지표의 다중 레이어를 사용하여 Atomic Analyst는 차트를 스캔하고 복잡한 수학적 계산을 간단한 신호와 색상으로 변환하여 초보 트레이더가 이해하고 일관된 거래 결정을 내릴 수 있도록합니다. "Atomic Analyst"는 새로운 및 경험이 풍부한 트레이더를위한 종합적인 거래 솔루션입니다. 프리미엄 지표와 최고 수준의 기능을 하나의 거래 전략에 결합하여 모든 종류의 트레이더에 대한 다재다능한 선택지가되었습니다. 인트라데이 거래 및 스캘핑 전략 : 빠르고 정확한 일일
KT Trend Trading Suite MT4
KEENBASE SOFTWARE SOLUTIONS
KT Trend Trading Suite는 트렌드 추종 전략과 여러 돌파 지점을 결합한 다기능 지표입니다. 이러한 돌파 지점은 진입 신호로 사용됩니다. 새로운 추세가 형성되면 이 지표는 여러 번의 진입 기회를 제공하여 트렌드를 성공적으로 따라갈 수 있도록 돕습니다. 덜 중요한 진입 신호를 피하기 위해 되돌림 기준값이 사용됩니다. MT5 버전은 여기에서 확인할 수 있습니다  https://www.mql5.com/en/market/product/46270 기능 여러 가지 시장 흐름을 하나의 수식으로 결합하여 현재 추세를 명확하게 시각화합니다. 진입 신호가 발생한 구간에 직사각형 박스를 표시하여 지역 고점과 저점을 명확히 나타냅니다. 신호의 정확도를 측정하고 간단한 성능 지표를 제공합니다. 다중 시간대 대시보드를 포함하여 모든 시간 프레임을 스캔하고 각 시간대의 추세 방향을 표시합니다. 입력 파라미터 History Bars:   과거 신호 분석에 사용할 히스토리 바 개수입니다.
No Repaint Bext is a ready-made trading system. Shows when to open and when to close trades, as well as in which direction. Every time a green arrow appears, you need to open a buy trade. Close all buy trades when a red arrow appears. The same goes for the opposite direction, every time a red arrow appears, open sell trades and close them all when a green arrow appears. We use the M5 timeframe for trading. You can trade on any cozy pair. This indicator does not repaint and practically does not
Smc Blast Signal
Mohit Dhariwal
3.4 (5)
OFFER OFFER! The price of the indicator is kept at 75 dollars only from 20th Feb to 28th Feb. Full Fledged EA and Alert plus for alerts will also be provided in this offer along with the purchase of Indicator. Limited copies only at this price and Ea too. Grab your copy soon Alert plus for indicator with set file is kept in comment section with the image  SMC Blast Signal with FVG, BOS and trend Breakout The SMC Blast Signal is a Precise trading system for Meta Trader 4 that uses Smart Money Con
M1 Arrow
Oleg Rodin
4.81 (21)
시장의 두 가지 기본 원칙에 기반한 일중 전략. 알고리즘은 추가 필터를 사용하여 거래량 및 가격 파동 분석을 기반으로 합니다. 지표의 지능형 알고리즘은 두 가지 시장 요인이 하나로 결합될 때만 신호를 제공합니다. 지표는 더 높은 시간 프레임의 데이터를 사용하여 M1 차트에서 특정 범위의 파도를 계산합니다. 그리고 파동을 확인하기 위해 지표는 볼륨 분석을 사용합니다. 이 표시기는 준비된 거래 시스템입니다. 트레이더가 필요로 하는 모든 것은 신호를 따르는 것입니다. 또한 지표는 자신의 거래 시스템의 기초가 될 수 있습니다. 거래는 분 차트에서만 수행됩니다. 지표가 MTF 원리를 사용한다는 사실에도 불구하고 지표 알고리즘은 가능한 한 안정적입니다. 구매 후 반드시 저에게 편지를 보내주세요! 내 거래 설정 및 권장 사항을 공유하겠습니다!
Top Bottom Tracker MT4
Rodrigo Arana Garcia
탑 바텀 트래커는 시장 추세를 분석하고 추세의 고점과 저점을 감지할 수 있는 정교한 알고리즘을 기반으로 하는 지표입니다 / MT5 버전 . 가격은 500$에 도달할 때까지 점진적으로 상승합니다. 다음 가격 --> $99 특징 다시 칠하지 않음 이 표시기는 새 데이터가 도착해도 값을 변경하지 않습니다 거래 쌍 모든 외환 쌍 기간 모든 기간 파라미터 ==== 인디케이터 구성 ==== 구성 매개 변수 // 40 (값이 높을수록 신호가 적지만 더 정확한 신호가 제공됩니다) 상위 레벨 값 // 80 (상단 수평선의 값) 하단 레벨 값 // 20 (하단 수평선 값) 인디케이터 계산 막대 수 // 3000 (인디케이터를 계산할 막대 수). 값 0은 모든 막대에 대해 인디케이터를 계산합니다) ==== 알람 구성 ==== 팝업 알림 // 참(터미널에서 알람) 이메일 알림 // 참(이메일로 알람 전송) 알람 시간 간격 // 10 (분 단위의 알람 간격) 경고
Currency Strength Exotics
Bernhard Schweigert
4.88 (33)
현재 20% 할인! 초보자 또는 전문가 트레이더를 위한 최고의 솔루션! 이 표시기는 Exotic Pairs Commodities, Indexes 또는 Futures와 같은 기호에 대한 통화 강도를 표시하는 데 특화되어 있습니다. 금, 은, 석유, DAX, US30, MXN, TRY, CNH 등의 진정한 통화 강도를 보여주기 위해 9번째 줄에 모든 기호를 추가할 수 있습니다. 이것은 독특하고 고품질이며 저렴한 거래 도구입니다. 우리는 많은 독점 기능과 새로운 공식을 통합했습니다. 새로운 추세 또는 스캘핑 기회의 정확한 트리거 포인트를 정확히 찾아낼 수 있기 때문에 거래가 어떻게 개선될지 상상해 보십시오. 사용 설명서: 여기를 클릭 https://www.mql5.com/en/blogs/post/708876 모든 시간대에 작동합니다. TREND를 빠르게 확인할 수 있습니다! 새로운 기본 알고리즘을 기반으로 설계되어 잠재적인 거래를 더욱 쉽게 식별하고 확인할 수 있습니다. 8개의
The Super Arrow Indicator provides non-repainting buy and sell signals with exceptional accuracy. Key Features No repainting – confirmed signals remain fixed Clear visual arrows: green for buy, red for sell Real-time alerts via pop-up, sound, and optional email Clean chart view with no unnecessary clutter Works on all markets: Forex, gold, oil, indices, crypto Adjustable Parameters TimeFrame Default: "current time frame" Function: Sets the time frame for indicator calculation Options: Can be set
Prime Strike Signal
Camila Bernardez Camero
Prime Strike Signal – 명확한 진입, 리페인트 없음. Prime Strike Signal No Repaint Never는 시장이 급변할 때에도 명확하고 일관된 시그널을 원하는 트레이더를 위해 설계된 간단하고 규칙 기반의 도구입니다. 방향 전환을 즉시 차트에 화살표로 표시해주며, 복잡한 분석 없이도 단기 가격 흐름에 쉽게 따라갈 수 있도록 도와줍니다. 최신 정보 받기 업데이트 및 신규 출시 소식을 빠르게 받으려면 공식 채널에 가입하세요: https://www.mql5.com/en/channels/signalsandindicators 로직 이 시스템은 서로 다른 평활 기간을 가진 두 가지 가격 기반 계산을 비교하여 모멘텀 변화를 감지합니다. 계산된 차이는 두 번째 로직 계층에서 필터링되어, 유효한 크로스가 발생할 경우에만 시그널을 생성합니다. 이는 불필요한 노이즈가 아닌 실제 움직임에 기반한 진입을 보장합니다. 리페인트 하나요? 아니요. 이 도구는 캔들이
제작자의 제품 더 보기
Reversal signal mtf
Pavel Shutovskiy
The indicator displays trend reversal in the form of arrows. The indicator does not change its values (is not redrawn) after a signal. The program notifies about arrows by means of a pop-up window, or sending notification to e-mail. This is a multitimeframe instrument. Values of the indicator may be displayed from higher timeframes. Parameters Time-frame - select time session; zero is the current timeframe (Time-frame cannot be lower than the current time interval). Bars - number of bars on the
ADX arrow
Pavel Shutovskiy
5 (1)
ADX arrow The indicator displays crossings of the ADX indicator (Average Directional Movement Index) lines as dots simplifying detection of signals. The indicator also features pop-up and email alerts. Parameters Period - averaging period. Apply to - applied price: Open, Close, High, Low, Median, (high+low)/2, typical, (high+low+close)/3, weighted Close, (high+low+close+close)/4. Alert - enable/disable pop-up alerts. EMail - enable/disable email alerts.
Beacon
Pavel Shutovskiy
5 (2)
The indicator determines overbought/oversold zones on various timeframes. Arrows show market trend in various time sessions: if the market leaves the overbought zone, the arrow will indicate an ascending trend (arrow up), if the market leaves the oversold zone, the arrow will indicate a descending trend (arrow down). Situation on the timeframe, where the indicator is located, is displayed in the lower right window. Information on the market location (overbought or oversold zone), as well as the
FREE
OsMA Arrow MTF
Pavel Shutovskiy
3.9 (10)
The indicator displays crossing zero level by Moving Average of Oscillator (OsMA) in the form of arrows. The this is a multi-timeframe indicator, and it displays signals from other timeframes. The indicator notifies about a signal by means of a pop-up Alert window, or sending notification to e-mail. Parameters Time-frame - select timeframe to show indicator signals. Fast EMA Period - fast EMA. This is an exponential moving average from a price with a short period. Slow EMA Period - slow EMA. Th
FREE
AD Trend line
Pavel Shutovskiy
5 (1)
AD Trend line draws trend lines on the basis of A/D indicator (Accumulation/Distribution). When A/D indicator breaks a trend line, the probability of the trend reversal is very high. This is a multitimeframe indicator which can display values from higher timeframes. Parameters Time-frame — Select a timeframe; zero is the current timeframe of the chart; Trend Line — Display lines on the chart; Apply to — Apply lines to close the candle's highest/lowest value; Width line — Width of the line; Style
FREE
OsMA Arrow
Pavel Shutovskiy
3.83 (6)
The indicator displays crossing zero level by Moving Average of Oscillator (OsMA) in the form of arrows. The indicator notifies about a signal by means of a pop-up Alert window, or sending notification to e-mail. Parameters Fast EMA Period - fast EMA. This is an exponential moving average from a price with a short period. Slow EMA Period - slow EMA. This is also an exponential moving average of a market price but with a longer period. Signal SMA Period - MACD SMA. This is a signal line which is
FREE
Trend following
Pavel Shutovskiy
4.5 (2)
The EA in the form of histogram displays up and down trends. This tool is recommended to be used as a filter. Its readings will help to detect beginning, end, and continuation of a trend. This additional tool will suit any trading system. Parameters Period — indicator period; Bars — number of bars on the history.
FREE
MA 2 Histogram
Pavel Shutovskiy
4.5 (2)
The indicator is based on two Moving Averages. Its only difference from traditional indicators is that it is presented as a histogram. The histogram has four colors; each color represents a MA with its own period. In case of a descending trend, if a price is lower than a moving average, the indicator displays a value lower than the red zero level. In case of ascending trend, the indicator value is higher than the green zero level. Parameters: Period MA 1 - Period of the first moving average. MA
FREE
AC Arrow
Pavel Shutovskiy
4 (2)
The indicator displays zero level Accelerator Oscillator (AC) crossover in the form of dots on the chart. In indicator settings one can specify number of bars in the history to display signals, as well as shift of dots with respect to a bar. Parameters Bars — number of bars in the history to display indicator's signals; Shift — shift of dots with respect to bars.
FREE
Maps
Pavel Shutovskiy
4.75 (4)
The indicator displays on the chart a map, on which markers show the current trading session, as well as shows a text. The indicator provides two types of background display: white and black. The indicator is displayed as the background and does not hinder tracking the current market situation. Parameters: GMT -  the time difference of the terminal and GMT. Background - selection of background - black or white.
FREE
Fibo
Pavel Shutovskiy
5 (2)
The script sets Fibonacci levels on the chart using maximums and minimums visible on the chart. The script names Fibo with such timeframe on which it has been launched (Fibo D1 or Fibo M30, etc.), therefore preserving previously constructed levels on different time charts. This instrument will be useful for those who start studying Fibonacci levels and those who need to form these levels in a speedy fashion. The script does not have additional settings. Fibonacci lines can be amended in standard
FREE
Any chart has patterns of consolidation which are also called accumulation patterns. These are sections where the market has been on the same price level during significant amount of time, and thus it was accumulating positions. After such accumulation, positions are distributing, and the market passes from flat into trend. The Consolidation Levels indicator is a professional tool which identifies these sections and builds levels according to the price of the market at the moment of consolidatio
ATR Pivot
Pavel Shutovskiy
The indicator calculates the levels by ATR daily range using the equations: 1AR = Open + ATR -1AS = Open - ATR AR 1/2 = Open + (ATR / 2) AS -1/2 = Open - (ATR / 2) AR 1/4 = Open + (ATR / 4) AS -1/4 = Open - (ATR / 4) AR 3/4 = Open + ((ATR*3) / 4) AS -3/4 = Open - ((ATR*3) / 4) AR 2 = Open + (ATR*2) AS -2 = Open - (ATR*2) Parameters Period ATR - ATR period Shift time - shift by time for Open Color opening of day - Open line color Color 1AR, -1AS - 1AR, -1AS line color Color AR 1/2, AS -1/2 - AR 1
Max Min Levels
Pavel Shutovskiy
The indicator makes levels according to local maximums and minimums of a week, a month, or a year. Parameters: Week number - number of weeks for lines display Week level color - Week line color Month number - number of months for lines display Month level color - Month line color Year number - number of years for lines display Year level color - Year line color Width line - Width of lines Style line - Style of lines
AO AC Signal
Pavel Shutovskiy
The indicator displays signals of different indicators (which can be selected in parameters) on a chart when zero level is crossed. AO, AC or AO+AC if signals of two indicators coincide. The indicator shows an Alert message (pop-up window) when a signal appears. Parameters: Indicators - Selection of the indicator AO, AC, AO+AC. Bars - Number of bars in history for display of signals. Alert - Pop-up window in case of a signal.
Beginning
Pavel Shutovskiy
The indicator builds levels from beginning of a week or a month, or according to local Highs and Lows. These levels are meant for detection of strong support and resistance levels on a chart. Most big players of the market are guided by particularly these data: opening of the week or opening of the month. Breakout of one or several Highs and price consolidation on these levels suggest that market intends to grow. Breakout of Lows and price consolidation bears evidence of market's intention to mo
F trend
Pavel Shutovskiy
The indicator is designed for scalping fans, it gives signals of an average of ten pips. The indicator is based on mathematical calculation, it determines the average range of the price channel, which is generally formed at the time of accumulation of positions. Once the price moves beyond its borders, a signal is generated in the form of an arrow. The indicator has a minimum of settings: the period for which you need to calculate, and the frequency of signals (the signal frequency is determined
Woltec
Pavel Shutovskiy
4 (1)
The indicator has been developed for scalping. The indicator is based on a mathematical calculation that determines the percent range of the price channel, which is generally formed at the time of the accumulation of positions. Once the price moves beyond its borders, a signal is generated in the form of dots. The indicator has a minimum of settings - the frequency of signals. Smaller values produce more signals. Parameters: Multiplier - the frequency of signals (with lower values signals are m
Jaguar tac
Pavel Shutovskiy
The indicator uses the Envelopes channel in its calculations, which allows working with dynamic support and resistance levels. It also considers the direction and strength of the trend, as well as the mathematical calculation that determines the percent range of the price channel, which is generally formed at the time of the accumulation of positions. It first generates a preliminary signal in the form of a round arrow. Then it is necessary to wait for a normal arrow and enter the market only af
ADX trend
Pavel Shutovskiy
This indicator displays the signals of the ADX indicator (Average Directional Movement Index) as points on the chart. This facilitates the visual identification of signals. The indicator also features alerts (pop-up message boxes) and sending signals to e-mail. Parameters Period - averaging period. Apply to - price used for calculations: Close, Open, High, Low, Median (high+low)/2, Typical (high+low+close)/3, Weighted Close (high+low+close+close)/4. Alert - enable/disable alerts. EMail - enable
ADX arrow N
Pavel Shutovskiy
ADX arrow 이 표시기는 ADX 표시기의 신호(평균 방향 이동 지수)를 차트의 점으로 표시합니다. 이것은 신호의 시각적 식별을 용이하게합니다. 표시기는 또한 경고(팝업 메시지 상자)를 특징으로하고 전자 메일로 신호를 보냅니다. 매개 변수: Period  - 평균 기간. Apply to  - 계산에 사용 된 가격: Close, Open, High, Low, Median (high+low)/2, Typical (high+low+close)/3, Weighted Close (high+low+close+close)/4. Alert  - 경고 활성화/비활성화. EMail  - 전자 메일로 신호를 보내는 것을 활성화/비활성화합니다. Push -  푸시 할 신호 전송 활성화/비활성화.
ATR Pivots
Pavel Shutovskiy
The indicator calculates intraday levels based on the average daily price range, builds support and resistance levels that may be reversal. Parameters Period ATR - period of the ATR indicator Shift time - time offset for the opening of the day Color opening of day - color of the opening line of the day Color 1AR, -1AS - line color 1AR, -1AS Color AR 1/2, AS -1/2 - line color AR 1/2, AS Color AR 1/4, AS -1/4 - line color AR 1/4, AS -1/4 Color AR 3/4, AS -3/4 - line color AR 3/4, AS -3/4 Color
필터:
Andrzej Swietochowski
133
Andrzej Swietochowski 2021.03.08 12:52 
 

It's wasted money. The signal keeps shifting. This program cannot be trusted. The program repaints its signals. Don't buy it - it's a waste of time and a waste of your money. I haven't seen anything worse. The seller should refund your money for this. You can't build a strategy because no one knows when the signal was in the past, and these past signals shown - are repainted, changed. He even repaints 1 indicator.

Dine Scalpers
51
Dine Scalpers 2019.02.07 21:48 
 

Amazing Service - I was having trouble setting it up and Pavel very quickly sent me 3 different "set" files to load into the indicator and it is doing what it's supposed to do. Definitely worth it.

UPDATE: Having a little concern at the moment since after testing this product much more intently. If you are okay with repainting programs, then this is for you. I am currently using it in the most basic of forms and just wanted to know when the Main Line crosses the Signal Line when above 80% or below 20% for a fast and medium setting in the same time frame. This is a definitive point in time when using a candle closed condition. However, after it shows this, it continues to move the "Suggestion" arrow as the chart "flat lines" and there is not much movement either way, removes the suggested trade arrow if it begins reversing on you, and then also moves the arrow down to the optimal point when it does finally go up in the direction originally shown.

In Conclusion, if you are sitting there at your charts, it typically will provide an alert at the correct time but, unfortunately it tries to make things look prettier than they really are by repainting to the perfect spot. I have put in a request to see if this failing feature of so many programs that can absolutely mess up a strategy can be deleted and based on that, we will look into adjust the star rating.

Dine

리뷰 답변