Strategy Builder

5

Strategy Builder


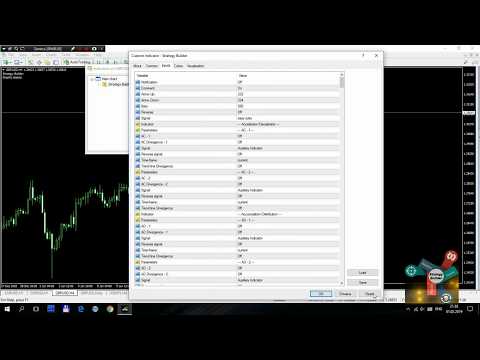
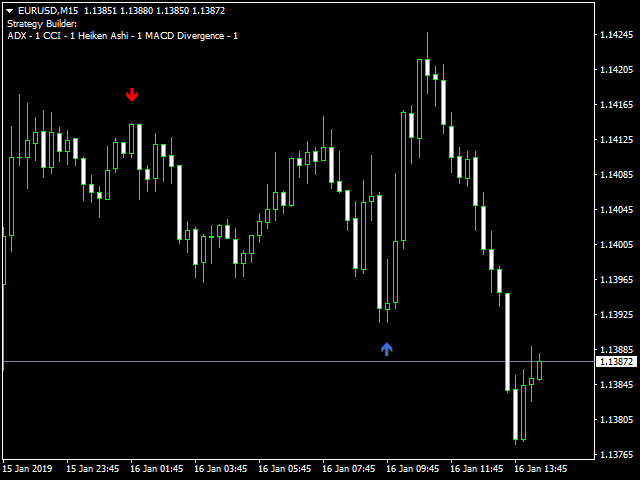
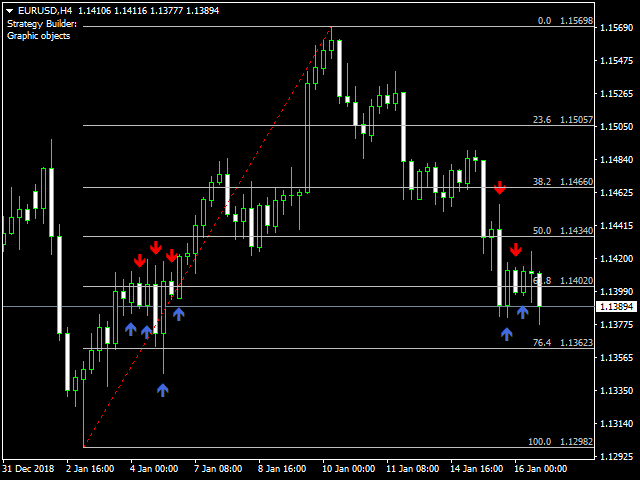
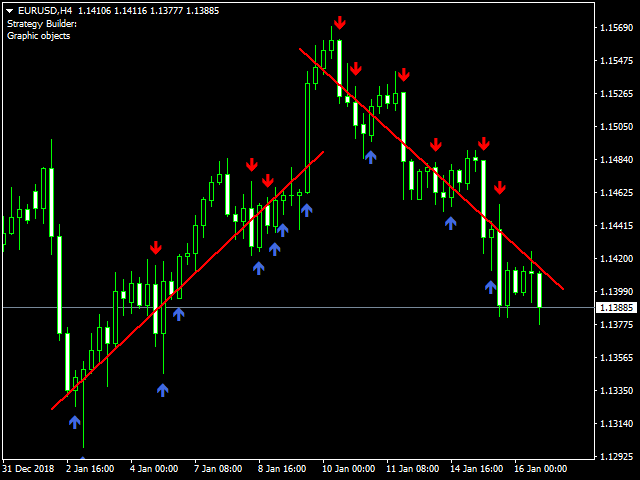
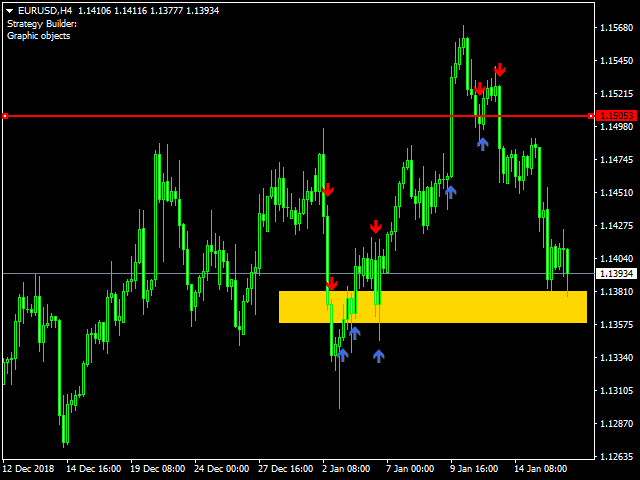
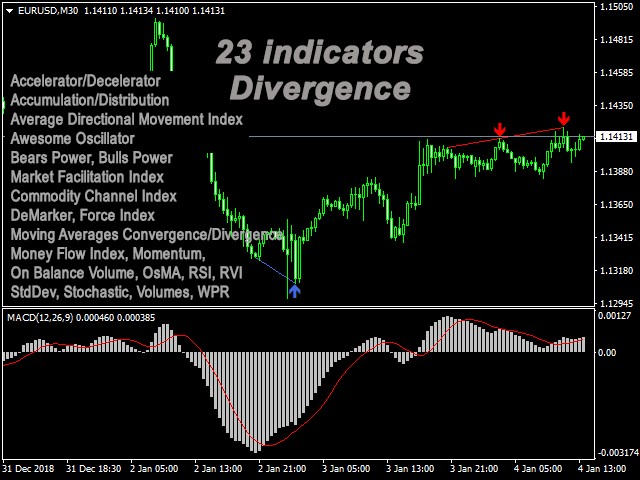
L'indicateur Strategy Builder vous permet de créer des stratégies classiques et individuelles sans charger le graphique avec un grand nombre d'indicateurs et sans suivre de nombreux indicateurs différents pour identifier le vrai signal. Strategy Builder affiche des signaux sous forme de flèches sur 30 indicateurs standard, 23 indicateurs montrant une divergence classique et cachée, recevant des signaux des niveaux de Fibonacci, horizontaux, lignes de tendance et rectangle. À l'aide de cet indicateur, vous pouvez recevoir des signaux d'un indicateur, ainsi que de plusieurs indicateurs en sélectionnant les indicateurs principaux et auxiliaires comme filtre dans les paramètres. 

Type d'indicateur: Tendance, Oscillateurs, Canaux, Niveaux, Multi-périodes, Volumes.


Les indicateurs sont dupliqués, il est donc possible d'obtenir les lectures, par exemple, RSI à partir de différents délais, il est possible de recevoir des signaux lors du franchissement des lignes (Croisement) sur 13 indicateurs.

Indicateur:

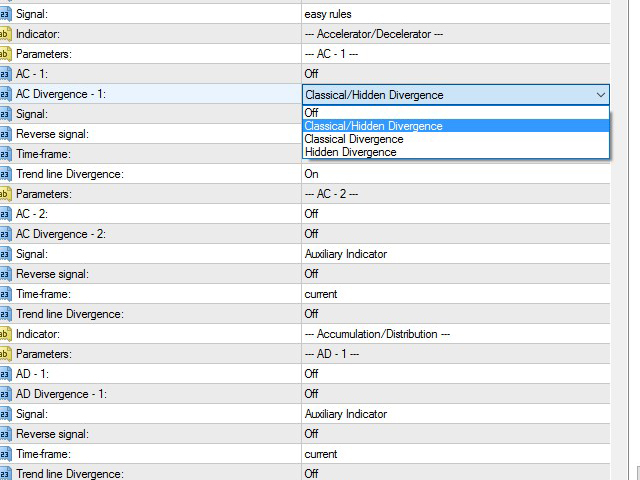
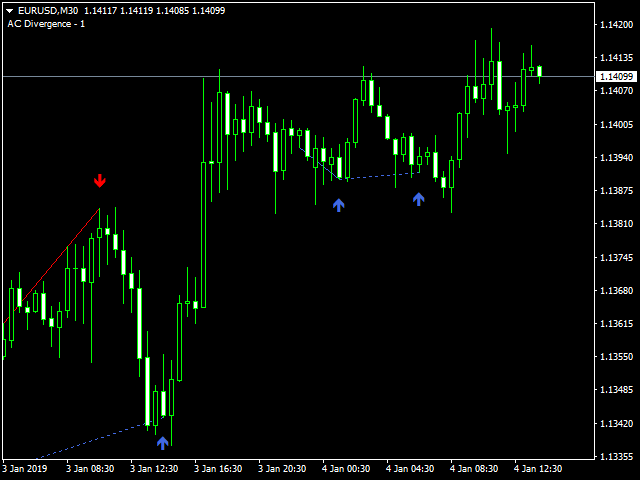
  • AC - Accelerator/Decelerator + Divergence
  • AD - Accumulation/Distribution + Divergence
  • ADX - Average Directional Movement Index + Divergence
  • Alligator
  • AO - Awesome Oscillator + Divergence
  • ATR - Average True Range + Divergence + Crossing
  • Bands - Bollinger Bands® 
  • Bears Power + Divergence
  • Bulls Power + Divergence
  • BWMFI - Market Facilitation Index - Divergence
  • CCI - Commodity Channel Index + Divergence + Crossing
  • DeMarker + Divergence + Crossing
  • Envelopes + Crossing
  • Force Index + Divergence + Crossing
  • Fractals
  • Gator Divergence
  • Heiken Ashi
  • Ichimoku - Ichimoku Kinko Hyo
  • MA - Moving Average + Crossing
  • MACD - Moving Averages Convergence/Divergence + Divergence
  • MFI - Money Flow Index + Divergence + Crossing
  • Momentum + Divergence + Crossing
  • OBV - On Balance Volume + Divergence
  • OsMA - Moving Average of Oscillator + Divergence
  • RSI - Relative Strength Index + Divergence + Crossing
  • RVI - Relative Vigor Index + Divergence + Crossing
  • SAR - Parabolic Stop and Reverse system
  • StdDev - Standard Deviation + Divergence + Crossing
  • Stochastic Oscillator + Divergence + Crossing
  • Volumes + Divergence
  • WPR - Larry Williams' Percent Range + Divergence + Crossing
  • ZigZag
  • Graphic objects (horizontal, trend lines, rectangle, Fibonacci levels)

Paramètre:

  • Notification -activer les notifications
  • Comment - pour afficher un commentaire sur les indicateurs inclus
  • Arrow Up - Caractères de police Wingdings pour le signal
  • Arrow Down - Caractères de police Wingdings pour le signal vers le bas
  • Bars - Le nombre de barres dans l'historique pour afficher les signaux de l'indicateur
  • Reverse - Signaux inversés de tous les indicateurs
  • Signal - Sélectionnez la méthode de formation du signal lors de l'utilisation de plusieurs indicateurs: des règles strictes - des signaux seront formés lorsque plusieurs signaux d'indicateurs coïncident sur une barre. règles faciles - les signaux seront formés selon la règle du filtre d'indicateur et de l'indicateur principal
Tous les paramètres sont publiés dans la discussion.

    L'appel de l'indicateur dans EA est limité par le nombre de paramètres d'entrée iCustom pour recevoir des signaux: l'indicateur doit être réglé sur le graphique, la réception du signal est possible à l'aide de la fonction GlobalVariableGet

        un exemple d'une fonction de réception de signaux dans EA:

        int IndicatorSignal(){
           if(GlobalVariableGet("Strategy Builder " + _Symbol + " " + (string)_Period) == 1.0) return 0; // sinal UP
        
           if(GlobalVariableGet("Strategy Builder " + _Symbol + " " + (string)_Period) == 2.0) return 1; // signal DOWN
        
           return -1;
        }


        Avis 2
        Dine Scalpers
        51
        Dine Scalpers 2019.02.07 21:48 
         

        Amazing Service - I was having trouble setting it up and Pavel very quickly sent me 3 different "set" files to load into the indicator and it is doing what it's supposed to do. Definitely worth it.

        UPDATE: Having a little concern at the moment since after testing this product much more intently. If you are okay with repainting programs, then this is for you. I am currently using it in the most basic of forms and just wanted to know when the Main Line crosses the Signal Line when above 80% or below 20% for a fast and medium setting in the same time frame. This is a definitive point in time when using a candle closed condition. However, after it shows this, it continues to move the "Suggestion" arrow as the chart "flat lines" and there is not much movement either way, removes the suggested trade arrow if it begins reversing on you, and then also moves the arrow down to the optimal point when it does finally go up in the direction originally shown.

        In Conclusion, if you are sitting there at your charts, it typically will provide an alert at the correct time but, unfortunately it tries to make things look prettier than they really are by repainting to the perfect spot. I have put in a request to see if this failing feature of so many programs that can absolutely mess up a strategy can be deleted and based on that, we will look into adjust the star rating.

        Dine

        Produits recommandés
        Indicateur unique qui met en œuvre une approche professionnelle et quantitative pour signifier le trading de réversion. Il capitalise sur le fait que le prix dévie et revient à la moyenne de manière prévisible et mesurable, ce qui permet des règles d'entrée et de sortie claires qui surpassent largement les stratégies de trading non quantitatives. [ Installation Guide | Update Guide | Troubleshooting | FAQ | All Products ] Des signaux de trading clairs Étonnamment facile à échanger Couleurs et t
        « Dynamic Scalping Oscillator » est un indicateur Crypto Forex personnalisé avancé, un outil de trading efficace pour MT4 ! - Nouvelle génération d'oscillateurs : voir les images pour comprendre leur utilisation. - L'oscillateur de scalping dynamique dispose de zones de survente/surachat adaptatives. - L'oscillateur est un outil auxiliaire permettant de trouver des points d'entrée précis dans les zones dynamiques de survente/surachat. - Valeurs de survente : inférieures à la ligne verte ; valeu
        VR Cub
        Vladimir Pastushak
        VR Cub est un indicateur permettant d'obtenir des points d'entrée de haute qualité. L'indicateur a été développé pour faciliter les calculs mathématiques et simplifier la recherche de points d'entrée dans un poste. La stratégie de trading pour laquelle l'indicateur a été rédigé prouve son efficacité depuis de nombreuses années. La simplicité de la stratégie de trading est son grand avantage, qui permet même aux traders débutants de négocier avec succès avec elle. VR Cub calcule les points d'ouve
        L'indicateur SMC Venom Model BPR est un outil professionnel pour les traders travaillant dans le concept Smart Money (SMC). Il identifie automatiquement deux modèles clés sur le graphique des prix: FVG   (Fair Value Gap) est une combinaison de trois bougies, dans laquelle il y a un écart entre la première et la troisième bougie. Forme une zone entre les niveaux où il n'y a pas de support de volume, ce qui conduit souvent à une correction des prix. BPR   (Balanced Price Range) est une combinaiso
        EARLY REMINDER: The Starting price is 65 price will rise soon up to 365$ and then 750$ after first 10 copies of sales. Grab this offer now! Introduction Hello, traders! Welcome to the demonstration of the Forex Beast Indicator , a comprehensive tool designed to assist aspiring traders in navigating the complexities of the forex market. This indicator incorporates seven essential components to provide a well-rounded trading experience: Moving Averages Colored Zones Support and Resistance Levels
        Super Reversal Pattern
        Parfait Mujinga Ndalika
        Super Reversal Pattern Indicator Unlock the power of advanced pattern recognition with our Super Reversal Pattern Indicator. Designed for traders seeking precision and reliability, this indicator identifies one of the most effective reversal patterns in technical analysis, offering a significant edge in your trading strategy. Key Features: Non-Repainting Accuracy: Enjoy the confidence of non-repainting technology. Once a Super Reversal Pattern is detected, it remains static, providing consiste
        Indicator for binary options arrow is easy to use and does not require configuration works on all currency pairs, cryptocurrencies buy signal blue up arrow sell signal red down arrow tips do not trade during news and 15-30 minutes before their release, as the market is too volatile and there is a lot of noise it is worth entering trades one or two candles from the current period (recommended for 1 candle) timeframe up to m 15 recommended money management fixed lot or fixed percentage of the depo
        SystemBinaryM1
        Andrey Spiridonov
        SystemBinaryM1 - a professional indicator for trading short-term binary options, is a complete, self-contained author's strategy for working in the binary options market. The unique algorithm for analyzing the foreign exchange market is based on the calculation of reference points on three different time periods M15, M5. M1. Thus, the indicator simultaneously analyzes the long-term, medium-term and short-term price behavior before issuing a signal. The indicator is set in the usual way and work
        Binary Options Support Resistance Indicator This indicator is designed for binary options trading and effectively shows retracements from support and resistance levels. Signals appear on the current candle. A red arrow pointing downwards indicates a potential selling opportunity, while a blue arrow pointing upwards suggests buying opportunities. All that needs adjustment is the color of the signal arrows. It is recommended to use it on the M1-M5 timeframes as signals are frequent on these timef
        First Dawn
        Innovicient Limited
        The First Dawn indicator uses a unique mechanism to search and plot signals. This keeps searching for signals, making it a great indicator for scaping and identification of changes in direction, swing trading and trend trading. The  First Dawn   helps you get early signals. The backtest gives the true picture of how the indicator works with real/demo accounts. Although this is a tiny indicator it is packed with advantageous settings that will help you whether you desire to: Snap the Peaks and
        Angry
        Maryna Shulzhenko
        Angry is a trend indicator, it indicates well the points of the beginning of the trend and its completion or reversal. This tool scans the market looking for the correct entry. Against the background of insignificant fluctuations, it is possible to identify a trend and indicate its direction. It uses only price data and analytics to calculate entry points. Does not use auxiliary indicators. Angry captures moments of stable price movement direction. There are only three types of trend: Bullish
        Indicator. "Indicator wave or Indicator Ma". Using 23 standard indicators and the author's algorithm, the levels of purchases (from 0 to +100) and sales (from 0 to -100) are calculated. Then, using the calculated levels, the "Wave Indicator" draws a wave with 21 moving averages. The wave number is equal to the averaging period of the calculated levels. Waves # 1 - 7 Fast Moving Averages Waves from No. 8 -14 moving averages Waves from No. 15-21 slow moving averages Looking at the figures drawn
        "Stratégie de trading scalping" - l'indicateur a été créé pour le trading en utilisant le système de scalping. "Scalping trading strategy" indique sur le graphique avec une flèche où le prix ira maintenant. Une fois que l'indicateur a dessiné une flèche, le prix ira dans le sens de la flèche d'au moins 20 points. Cela nous suffit pour commercer efficacement. "Scalping trading strategy" ne redessine pas ses signaux. L'indicateur a de nombreux modes de fonctionnement différents. Il peut dessiner
        Le Fisher Yur4ik MT4 est un indicateur de trading avancé qui exploite la puissance de l'analyse technique pour fournir aux traders des informations précises sur les tendances du marché. Conçu spécifiquement pour MetaTrader 4, cet indicateur est idéal pour les traders cherchant à améliorer leur processus de prise de décision et à optimiser leurs résultats de trading. En utilisant le Fisher Yur4ik MT4, les traders peuvent obtenir un avantage concurrentiel grâce à des alertes en temps réel et des s
        STRUCTURAL TREND LINES - MT4 Indicator Simple indicator that automatically draws trend lines based on market structure. Features: - 3 degrees of structure detection (short, medium, long term) - Configurable swing strength for each degree - Single color per degree for clean visualization - Adjustable number of lines per degree - Customizable colors and line widths How it works: The indicator identifies swing highs and lows based on the strength parameter, then connects these points to create t
        MajorAlert
        Sergei Vassunov
        MajorAlert - is a professional trading indicator for MetaTrader 4 that combines two distinct market analysis approaches into one powerful tool. By integrating a counter‑trend entry logic (upper block) with a trend‑following filter (lower block), the indicator generates high‑probability signals on the chart with clearly separated arrow colors. Key Features Fully self‑contained   – no external indicators required; all calculations are built‑in. Versatile inputs   – adjust all parameters to suit a
        Stochastic BR
        Antony Augustine
        Stochastic BR allows you to recognize reversals professionally. The "Stochastic BR" is designed to recognize profitable counter trend patterns from your chart. Stochastic Indicator: This technical indicator was developed by George Lane more than 50 years ago. The reason why this indicator survived for so many years is because it continues to show consistent signals even in these current times. The Stochastic indicator is a momentum indicator that shows you how strong or weak the current trend i
        This indicator displays the ZigZag Pointer Fibonacci Expansion Triangle movements timeframes only M1-W1. Parameters InDepth: Displays the Depth movements. InDeviation: Displays the Deviation movements. InBackstep: Displays the Backstep movements. Fibonacci Expansion: Displays the Fibonacci Expansion movements. Fibonacci Expansion true.(false) Triangle: Displays the Triangle movements. Triangle true.(false) How to understand the status: If the Triangle is green, trend is up. If the Triangle is r
        KT Horizontal Lines MT4
        KEENBASE SOFTWARE SOLUTIONS
        Dans MetaTrader, tracer plusieurs   lignes horizontales   et suivre leurs niveaux de prix respectifs peut rapidement devenir fastidieux. Cet indicateur trace automatiquement plusieurs lignes horizontales à intervalles réguliers pour définir des alertes de prix, afficher des niveaux de support et résistance, ou pour tout autre besoin manuel. Cet indicateur est idéal pour les traders débutants sur le marché du Forex, à la recherche d’opportunités pour réaliser des profits rapides à l’achat et à la
        RSI Speed mp
        DMITRII GRIDASOV
        Indicateur Crypto_Forex « RSI SPEED » pour MT4 : excellent outil prédictif, sans retouche. - Le calcul de cet indicateur est basé sur des équations physiques. Le RSI SPEED est la dérivée première du RSI lui-même. - Le RSI SPEED est idéal pour scalper les entrées dans la direction de la tendance principale. - Utilisez-le en combinaison avec un indicateur de tendance approprié, par exemple HTF MA (comme sur les images). - L'indicateur RSI SPEED indique la vitesse à laquelle le RSI change de dire
        Phase Analytics Pro: Advanced Cyclic Market Analyzer Phase Analytics Pro is a sophisticated technical tool designed for traders who prioritize mathematical precision over lag-heavy traditional indicators. Based on the principles of digital signal processing, this indicator decomposes price action into phase and quadrature components to identify the dominant market cycle. How it works: The algorithm calculates the instantaneous phase of the market, allowing it to distinguish between trending and
        This is a new strategy for SUPPLY DEMAND areas It is based on a calculation using the tick volume to detect the big price action in market for both bear /bull actions this smart volume action candles are used to determine the supply and demand areas prices in between main supply and demand lines indicate sideway market  up arrows will be shown when prices moves above the main supply and the secondary supply lines Down arrows will be shown when prices moves below the main demand and the secondary
        Alpha Trend sign est notre outil de Trading très populaire depuis longtemps, il valide notre système de Trading et invite clairement les signaux de Trading sans dérive. Fonctions principales: • En fonction de la zone active du marché, selon les indicateurs, il est intuitif de déterminer si le cours actuel appartient à la tendance ou à la tendance. Et coupez le marché selon les flèches d'indication de l'indicateur, les flèches vertes suggèrent d'acheter et les flèches rouges suggèrent de vend
        Royal Dutch Skunk
        Sayan Vandenhout
        ROYAL DUTCH SKUNK USES THE TREND WAVE INDICATOR AND IT CAN IDENTIFY THE BEGINNING AND THE END OF A NEW WAVE TREND MOVEMENT. AS AN OSCILLATOR, THE INDICATOR IDENTIFIES THE OVERBOUGHT AND OVERSOLD ZONES. IT WORKS GREAT TO CATCH THE SHORT TERM PRICE REVERSALS AND USES A MARTINGALE STRATEGY TO CLOSE ALL TRADES IN PROFIT. USE DEFAULT SETTINGS ON H1 OR HIGHER TIME FRAME ON ANY PAIR FOR MORE ACCURATE TRADES WHY THIS EA : Smart entries calculated by 6 great strategies The EA can be run on even a $20000
        NO REPAINT ADVANCED CHART PATTERN INDICATOR By definition, a price ( chart)  pattern is a recognizable configuration of price movement that is identified using a series of  trendlines  and/or curves. When a price pattern signals a change in trend direction, it is known as a reversal pattern; a continuation pattern occurs when the trend continues in its existing direction following a brief pause. Advanced Chart Pattern Tracker is designed to find the MOST ACCURATE patterns. A special script is a
        SuperTrend Alerts
        Libertas LLC
        3 (4)
        SuperTrend Alerts adds alerts to the widely popular SuperTrend indicator. As the name suggests, SuperTrend is a trending indicator which works best in trendy (not choppy) markets. SuperTrend is extremely popular for intraday and daily trading, and can be used on any timeframe. Place a call when the price closes above the SuperTrend line, and place a put when the price closes below the SuperTrend line. These crossovers are highlighted by non-repainting up/down arrows. Alerts Email, message and s
        Master head and shoulders patterns for better trading decisions A head and shoulders pattern is a chart formation that resembles a baseline with three peaks, the outside two are close in height and the middle is highest. It predicts a bullish-to-bearish trend reversal and is believed to be one of the most reliable trend reversal patterns. It is one of several top patterns that signal, with varying degrees of accuracy, that a trend is nearing its end. [ Installation Guide | Update Guide | Trouble
        "Auto FIBO Pro" Crypto_Forex indicator - est un excellent outil auxiliaire dans le trading ! - L'indicateur calcule et place automatiquement sur le graphique les niveaux de Fibo et les lignes de tendance locales (couleur rouge). - Les niveaux de Fibonacci indiquent les zones clés où le prix peut s'inverser. - Les niveaux les plus importants sont 23,6 %, 38,2 %, 50 % et 61,8 %. - Vous pouvez l'utiliser pour le scalping inversé ou pour le trading en grille de zones. - Il existe également de nombr
        Daily Candle Predictor est un indicateur qui prédit le cours de clôture d'une bougie. L'indicateur est principalement destiné à être utilisé sur les graphiques D1. Cet indicateur convient à la fois au trading forex traditionnel et au trading d'options binaires. L'indicateur peut être utilisé comme un système de trading autonome, ou il peut servir de complément à votre système de trading existant. Cet indicateur analyse la bougie actuelle, calcule certains facteurs de force à l'intérieur du corps
        PZ Trend Trading
        PZ TRADING SLU
        4.8 (5)
        Capture every opportunity: your go-to indicator for profitable trend trading Trend Trading is an indicator designed to profit as much as possible from trends taking place in the market, by timing pullbacks and breakouts. It finds trading opportunities by analyzing what the price is doing during established trends. [ Installation Guide | Update Guide | Troubleshooting | FAQ | All Products ] Trade financial markets with confidence and efficiency Profit from established trends without getting whips
        Les acheteurs de ce produit ont également acheté
        Neuro Poseidon MT4
        Daria Rezueva
        4.94 (36)
        Neuro Poseidon is a new indicator by Daria Rezueva. It combines precise trading signals with adaptive TP/SL levels - creating best possible trades as a result! Message me and get  Neuro Poseidon Assistant  as a gift to automize your trading process! What makes it stand out? 1. Proven profitability on all assets and timeframes 2. Only confirmed BUY and SELL signals present on the chart 3. Adaptive TP & SL levels generated by the software for each trade 4. Easy to understand - suitable for all
        Gann Made Easy
        Oleg Rodin
        4.84 (165)
        Gann Made Easy est un système de trading Forex professionnel et facile à utiliser qui est basé sur les meilleurs principes de trading en utilisant la théorie de mr. WD Gann. L'indicateur fournit des signaux d'ACHAT et de VENTE précis, y compris les niveaux Stop Loss et Take Profit. Vous pouvez échanger même en déplacement en utilisant les notifications PUSH. VEUILLEZ ME CONTACTER APRÈS L'ACHAT POUR RECEVOIR GRATUITEMENT DES INSTRUCTIONS DE TRADING ET D'EXCELLENTS INDICATEURS SUPPLÉMENTAIRES! Vou
        Trend Catcher ind
        Ramil Minniakhmetov
        5 (2)
        INDICATEUR DE DÉTECTEUR DE TENDANCE L'indicateur de détecteur de tendance analyse les mouvements de prix du marché grâce à une combinaison d'indicateurs d'analyse de tendance adaptatifs, propriétaires et personnalisés. Il identifie la véritable direction du marché en filtrant les fluctuations à court terme et en se concentrant sur la force de la dynamique sous-jacente, l'expansion de la volatilité et la structure des prix. Il utilise également une combinaison d'indicateurs personnalisés de lis
        M1 Sniper
        Oleg Rodin
        5 (24)
        M1 SNIPER est un système d'indicateurs de trading facile à utiliser. Il s'agit d'un indicateur à flèche conçu pour l'unité de temps M1. Cet indicateur peut être utilisé seul pour le scalping sur l'unité de temps M1 ou intégré à votre système de trading existant. Bien que conçu spécifiquement pour le trading sur l'unité de temps M1, ce système peut également être utilisé avec d'autres unités de temps. Initialement, j'avais conçu cette méthode pour le trading du XAUUSD et du BTCUSD. Cependant, je
        Advanced Supply Demand
        Bernhard Schweigert
        4.91 (300)
        Offre spéciale : 30 % de réduction La solution idéale pour les traders débutants comme experts ! Cet indicateur est un outil de trading unique, performant et abordable grâce à l’intégration de nombreuses fonctionnalités exclusives et d’une nouvelle formule. Cette mise à jour vous permet d’afficher des zones sur deux unités de temps. Vous pourrez ainsi visualiser non seulement une unité de temps supérieure, mais aussi l’unité de temps du graphique, ainsi que l’unité de temps supérieure : des z
        Cet indicateur est un indicateur d'analyse automatique des vagues, parfait pour le trading pratique ! Cas... Remarque :   je n'ai pas l'habitude d'utiliser des noms occidentaux pour l'évaluation des vagues. En raison de l'influence de la convention de dénomination de Tang Lun (Tang Zhong Shuo Zen), j'ai nommé la vague de base comme   un stylo   et la bande d'onde secondaire comme   un segment   . en même temps, le segment a la direction de la tendance.Le   segment de tendance principal   est no
        Scalper Inside PRO
        Alexey Minkov
        4.74 (68)
        Scalper Inside PRO Scalper Inside PRO is an intraday trend and scalping indicator for MetaTrader 4 that uses an exclusive algorithm to quickly detect market direction and key target levels. It automatically calculates entry, exit and multiple profit targets, and shows detailed performance statistics so you can see how different instruments and strategies performed. This helps you choose the most suitable trading instruments for the current market conditions. Additionally, you can easily integrat
        Current event:  https://c.mql5.com/1/326/A2SR2025_NoMusic.gif A. Qu'est-ce que l'A2SR ?   * C'est un indicateur technique avancé (pas de peinture, pas de retard). -- Conseils : -- sur https://www.mql5.com/en/blogs/post/734748/page4#comment_16532516 -- et https://www.mql5.com/en/users/yohana/blog A2SR a une technique spéciale pour déterminer les niveaux de Support (demande) et de Résistance (offre). Contrairement à la manière ordinaire que nous avons vue sur le net, A2SR a un concept original
        MetaBands M4
        Vahidreza Heidar Gholami
        3.5 (6)
        MetaBands uses powerful and unique algorithms to draw channels and detect trends so that it can provide traders with potential points for entering and exiting trades. It’s a channel indicator plus a powerful trend indicator. It includes different types of channels which can be merged to create new channels simply by using the input parameters. MetaBands uses all types of alerts to notify users about market events. Features Supports most of the channel algorithms Powerful trend detection algorith
        Genesis Matrix Pro is a professional multi-timeframe trend detection indicator designed to help traders identify high-quality market alignment with clarity and structure. It combines 12 different technical indicators into one visual alignment matrix, allowing traders to quickly see when market conditions are bullish, bearish, or neutral. A signal is generated only when the selected strategies are aligned, helping reduce noise and improve decision-making. PLEASE CONTACT ME AFTER PURCHASE TO GET
        Ce produit a été mis à jour pour le marché 2026 et optimisé pour les dernières versions de MT5. AVIS DE MISE À JOUR DU PRIX : Smart Trend Trading System est actuellement disponible à $99 . Le prix passera à $199 après les 30 prochains achats . OFFRE SPÉCIALE : Après avoir acheté Smart Trend Trading System, envoyez-moi un message privé pour recevoir Smart Universal EA GRATUITEMENT et transformer vos signaux Smart Trend en trades automatisés. Smart Trend Trading System est un système de trading c
        Dynamic Forex28 Navigator
        Bernhard Schweigert
        4.43 (7)
        Dynamic Forex28 Navigator - L'outil de trading Forex de nouvelle génération. ACTUELLEMENT 49 % DE RÉDUCTION. Dynamic Forex28 Navigator est l'évolution de nos indicateurs populaires de longue date, combinant la puissance de trois en un : Advanced Currency Strength28 Indicator (695 avis) + Advanced Currency IMPULSE avec ALERT (520 avis) + CS28 Combo Signals (Bonus). Détails sur l'indicateur https://www.mql5.com/en/blogs/post/758844 Qu'offre l'indicateur de force de nouvelle génération ? Tout
        Breakout Arrows Mt4
        Michael Oko Oboh
        5 (1)
        Trend Breakout Arrows Indicator The Trend Breakout Arrows Indicator is a momentum-based signal tool designed to identify potential bullish and bearish breakout opportunities. It displays clear arrow signals directly on the price chart, helping traders quickly recognize possible trend changes and continuation setups. Up Arrow (Buy Signal) A magenta up arrow appears below a candle when bullish momentum begins to strengthen. This signal indicates that buying pressure may be overtaking selling press
        BTMM State Engine Pro is a MetaTrader 4 indicator for traders who use the Beat The Market Maker approach: Asian session context, kill zone timing, level progression, peak formation detection, and a multi-pair scanner from a single chart. It combines cycle state logic with a built-in scanner dashboard so you do not need the same tool on many charts at once. What it does Draws the Asian session range; session times can follow broker server offset or be set in inputs. Tracks level progression (L
        IQ FX Gann Levels a precision trading indicator based on W.D. Gann’s square root methods . It plots real-time, non-repainting support and resistance levels to help traders confidently spot intraday and scalping opportunities with high accuracy. William Delbert Gann (W.D. Gann) was an exceptional market analyst, whose trading technique was based on a complex blend of mathematics, geometry, astrology, and ancient mathematics which proved to be extremely accurate. Setup & Guide:  Download  MT5 Ver
        Neo Wave PRO
        Nikolay Raykov
        5 (1)
        Price & Time Market Structure Indicator A professional market structure tool that analyzes waves through both price and time — not price alone. Main Description NeoWave PRO is a professional market structure indicator for MetaTrader 4 designed for traders who want to move beyond traditional one-dimensional wave tools such as ZigZag, swing indicators, and basic high/low systems. Most wave indicators analyze only one thing: Price. But a real market wave is not only a price movement. A true wave de
        Le système PRO Renko est un système de trading très précis spécialement conçu pour le trading de graphiques RENKO. Il s'agit d'un système universel qui peut être appliqué à divers instruments de négociation. Le système neutralise efficacement ce qu'on appelle le bruit du marché en vous donnant accès à des signaux d'inversion précis. L'indicateur est très facile à utiliser et n'a qu'un seul paramètre responsable de la génération du signal. Vous pouvez facilement adapter l'outil à n'importe que
        GOLD Impulse with Alert
        Bernhard Schweigert
        4.67 (12)
        Cet indicateur est une super combinaison de nos 2 produits Advanced Currency IMPULSE with ALERT  +   Currency Strength Exotics . Il fonctionne pour tous les cadres temporels et montre graphiquement l'impulsion de force ou de faiblesse pour les 8 principales devises plus un symbole ! Cet indicateur est spécialisé pour montrer l'accélération de la force des devises pour tout symbole comme l'or, les paires exotiques, les matières premières, les indices ou les contrats à terme. C'est le premier
        Market Structure Order Block Dashboard MT4 est un indicateur MetaTrader 4 conçu pour les traders qui veulent lire la structure de marché et les principales zones de réaction du prix directement sur le graphique. Il combine BOS, ChoCH, Order Blocks, Fair Value Gaps (FVG), Liquidité, Kill Zones, Volume Profile, et un dashboard compact pour une analyse rapide. Cet indicateur s'adresse aux traders qui utilisent la structure de marché, les concepts ICT et Smart Money comme cadre de décision. Il peut
        Une version MT5 est également disponible https://www.mql5.com/fr/market/product/170916 Version Swing M30/H1/H4 disponible Attraper les grands mouvements ? Gold Signal Swing Pro (M30/H1/H4). Objectif : $20-$80+ par trade. https://www.mql5.com/en/market/product/177643 KURAMA GOLD SIGNAL PRO (MT4) — Système de Trading XAUUSD Complet avec Filtre à 7 Couches, TP/SL Automatique et Notation de Qualité PAS DE REPAINT. PAS DE
        PZ 123 Pattern
        PZ TRADING SLU
        1 (1)
        Unlock powerful breakout opportunities The 123 Pattern is one of the most popular, powerful and flexible chart patterns. The pattern is made up of three price points: a bottom, a peak or valley, and a Fibonacci retracement between 38.2% and 71.8%. A pattern is considered valid when the price breaks beyond the last peak or valley, moment at which the indicator plots an arrow, rises an alert, and the trade can be placed. [ Installation Guide | Update Guide | Troubleshooting | FAQ | All Products  ]
        Enigmera
        Ivan Stefanov
        5 (8)
        ENIGMERA : Le cœur du marché Important : La démo de MQL5.com fonctionne dans le Strategy Tester et peut ne pas refléter pleinement les fonctionnalités d'Enigmera. Consultez la description, les captures d'écran et la vidéo pour plus de détails. N'hésitez pas à m'envoyer un message si vous avez des questions ! Le code de l'indicateur a été entièrement réécrit. La version 3.0 ajoute de nouvelles fonctionnalités et corrige les bugs accumulés depuis le lancement de l'indicateur. Introduction Cet in
        Introduction Harmonic Patterns are best used to predict potential turning point. Traditionally, Harmonic Pattern was identified manually connecting peaks and troughs points in the chart. Manual harmonic pattern detection is painfully tedious and not suitable for everyone. You are often exposed under subjective pattern identification with manual pattern detection. To avoid these limitations, Harmonic Pattern Plus was designed to automate your harmonic pattern detection process. The functionality
        Le détecteur de séisme de marché  sismographique. Description in English : https://www.mql5.com/en/market/product/113869?source=Site+Market+Product+Page#description How to use the Seismograph : https://www.mql5.com/en/market/product/113869#!tab=comments&page=2&comment=52806941 Create an EA : https://www.mql5.com/en/market/product/113869#!tab=comments&page=3&comment=52816509 Quelle que soit la façon dont vous tradez, vous voulez absolument éviter d'entrer sur le marché à faible liquidité.-
        Scalper Vault
        Oleg Rodin
        5 (37)
        Scalper Vault est un système de scalpage professionnel qui vous fournit tout ce dont vous avez besoin pour un scalpage réussi. Cet indicateur est un système de trading complet qui peut être utilisé par les traders de forex et d'options binaires. Le délai recommandé est M5. Le système vous fournit des signaux fléchés précis dans le sens de la tendance. Il vous fournit également des signaux supérieurs et inférieurs et des niveaux de marché Gann. Les indicateurs fournissent tous les types d'alertes
        Delta Fusion Pro
        Francesco Secchi
        5 (2)
        Delta Fusion Pro – Analyse Avancée du Flux d’Ordres pour le Trading Intraday Delta Fusion Pro est un indicateur professionnel pour MetaTrader 4 qui révèle le flux des ordres agressifs, en affichant l’intensité et la direction de la pression institutionnelle en temps réel. Contrairement aux indicateurs volumétriques traditionnels, il analyse la delta entre les volumes Ask et Bid afin d’anticiper les retournements, confirmer les tendances et identifier les zones d’intérêt professionnel. Caractér
        Trend Lines PRO
        Roman Podpora
        5 (1)
        TREND LINES PRO     Cet indicateur permet de comprendre les véritables changements de direction du marché. Il révèle les renversements de tendance et les points de retour des principaux acteurs. Tu vois     Lignes BOS     Détection des changements de tendance et des niveaux clés sur des unités de temps supérieures, sans paramètres complexes ni interférences inutiles. Les signaux restent affichés sur le graphique même après la fermeture de la bougie. VERSION MT 5    -     Révèle son potentiel max
        The Propfolio Master Suite is the ultimate all-in-one analytical workstation for professional traders. Combining the power of the Beat The Market Maker (BTMM) methodology, Smart Money Concepts (SND/Liquidity), and Advanced Volume Profile, this suite replaces multiple different indicators with one optimized engine. Monitor up to 14 pairs simultaneously from a single chart, instantly identify market cycles, and seamlessly map institutional footprints with the click of a button. The Command Center
        RFI levels PRO
        Roman Podpora
        5 (1)
        L'indicateur montre avec précision les points de retournement et les zones de retour des prix où le       Acteurs majeurs   . Vous repérez les nouvelles tendances et prenez des décisions avec une précision maximale, en gardant le contrôle de chaque transaction. VERSION MT5     -     Révèle son potentiel maximal lorsqu'il est combiné à l'indicateur   TREND LINES PRO Ce que l'indicateur montre : Structures et niveaux d'inversion avec activation au début d'une nouvelle tendance. Affichage des nive
        ACTUELLEMENT 40% DE RÉDUCTION ! ! La meilleure solution pour tout débutant ou Expert Trader ! Cet indicateur est un outil de trading unique, de haute qualité et abordable car nous avons incorporé un certain nombre de caractéristiques exclusives et une formule secrète. Avec seulement UN graphique, il donne des alertes pour les 28 paires de devises. Imaginez comment votre trading s'améliorera parce que vous serez capable de repérer le point de déclenchement exact d'une nouvelle tendance ou d'un
        Plus de l'auteur
        ADX arrow
        Pavel Shutovskiy
        5 (1)
        ADX arrow The indicator displays crossings of the ADX indicator (Average Directional Movement Index) lines as dots simplifying detection of signals. The indicator also features pop-up and email alerts. Parameters Period - averaging period. Apply to - applied price: Open, Close, High, Low, Median, (high+low)/2, typical, (high+low+close)/3, weighted Close, (high+low+close+close)/4. Alert - enable/disable pop-up alerts. EMail - enable/disable email alerts.
        OsMA Arrow MTF
        Pavel Shutovskiy
        3.9 (10)
        The indicator displays crossing zero level by Moving Average of Oscillator (OsMA) in the form of arrows. The this is a multi-timeframe indicator, and it displays signals from other timeframes. The indicator notifies about a signal by means of a pop-up Alert window, or sending notification to e-mail. Parameters Time-frame - select timeframe to show indicator signals. Fast EMA Period - fast EMA. This is an exponential moving average from a price with a short period. Slow EMA Period - slow EMA. Th
        FREE
        OsMA Arrow
        Pavel Shutovskiy
        3.83 (6)
        The indicator displays crossing zero level by Moving Average of Oscillator (OsMA) in the form of arrows. The indicator notifies about a signal by means of a pop-up Alert window, or sending notification to e-mail. Parameters Fast EMA Period - fast EMA. This is an exponential moving average from a price with a short period. Slow EMA Period - slow EMA. This is also an exponential moving average of a market price but with a longer period. Signal SMA Period - MACD SMA. This is a signal line which is
        FREE
        Beacon
        Pavel Shutovskiy
        5 (2)
        The indicator determines overbought/oversold zones on various timeframes. Arrows show market trend in various time sessions: if the market leaves the overbought zone, the arrow will indicate an ascending trend (arrow up), if the market leaves the oversold zone, the arrow will indicate a descending trend (arrow down). Situation on the timeframe, where the indicator is located, is displayed in the lower right window. Information on the market location (overbought or oversold zone), as well as the
        FREE
        AC Arrow
        Pavel Shutovskiy
        4 (2)
        The indicator displays zero level Accelerator Oscillator (AC) crossover in the form of dots on the chart. In indicator settings one can specify number of bars in the history to display signals, as well as shift of dots with respect to a bar. Parameters Bars — number of bars in the history to display indicator's signals; Shift — shift of dots with respect to bars.
        FREE
        MA 2 Histogram
        Pavel Shutovskiy
        4.5 (2)
        The indicator is based on two Moving Averages. Its only difference from traditional indicators is that it is presented as a histogram. The histogram has four colors; each color represents a MA with its own period. In case of a descending trend, if a price is lower than a moving average, the indicator displays a value lower than the red zero level. In case of ascending trend, the indicator value is higher than the green zero level. Parameters: Period MA 1 - Period of the first moving average. MA
        FREE
        AD Trend line
        Pavel Shutovskiy
        5 (1)
        AD Trend line draws trend lines on the basis of A/D indicator (Accumulation/Distribution). When A/D indicator breaks a trend line, the probability of the trend reversal is very high. This is a multitimeframe indicator which can display values from higher timeframes. Parameters Time-frame — Select a timeframe; zero is the current timeframe of the chart; Trend Line — Display lines on the chart; Apply to — Apply lines to close the candle's highest/lowest value; Width line — Width of the line; Style
        FREE
        Trend following
        Pavel Shutovskiy
        4.5 (2)
        The EA in the form of histogram displays up and down trends. This tool is recommended to be used as a filter. Its readings will help to detect beginning, end, and continuation of a trend. This additional tool will suit any trading system. Parameters Period — indicator period; Bars — number of bars on the history.
        FREE
        Fibo
        Pavel Shutovskiy
        5 (2)
        The script sets Fibonacci levels on the chart using maximums and minimums visible on the chart. The script names Fibo with such timeframe on which it has been launched (Fibo D1 or Fibo M30, etc.), therefore preserving previously constructed levels on different time charts. This instrument will be useful for those who start studying Fibonacci levels and those who need to form these levels in a speedy fashion. The script does not have additional settings. Fibonacci lines can be amended in standard
        FREE
        Maps
        Pavel Shutovskiy
        4.75 (4)
        The indicator displays on the chart a map, on which markers show the current trading session, as well as shows a text. The indicator provides two types of background display: white and black. The indicator is displayed as the background and does not hinder tracking the current market situation. Parameters: GMT -  the time difference of the terminal and GMT. Background - selection of background - black or white.
        FREE
        Any chart has patterns of consolidation which are also called accumulation patterns. These are sections where the market has been on the same price level during significant amount of time, and thus it was accumulating positions. After such accumulation, positions are distributing, and the market passes from flat into trend. The Consolidation Levels indicator is a professional tool which identifies these sections and builds levels according to the price of the market at the moment of consolidatio
        ATR Pivot
        Pavel Shutovskiy
        The indicator calculates the levels by ATR daily range using the equations: 1AR = Open + ATR -1AS = Open - ATR AR 1/2 = Open + (ATR / 2) AS -1/2 = Open - (ATR / 2) AR 1/4 = Open + (ATR / 4) AS -1/4 = Open - (ATR / 4) AR 3/4 = Open + ((ATR*3) / 4) AS -3/4 = Open - ((ATR*3) / 4) AR 2 = Open + (ATR*2) AS -2 = Open - (ATR*2) Parameters Period ATR - ATR period Shift time - shift by time for Open Color opening of day - Open line color Color 1AR, -1AS - 1AR, -1AS line color Color AR 1/2, AS -1/2 - AR 1
        Max Min Levels
        Pavel Shutovskiy
        The indicator makes levels according to local maximums and minimums of a week, a month, or a year. Parameters: Week number - number of weeks for lines display Week level color - Week line color Month number - number of months for lines display Month level color - Month line color Year number - number of years for lines display Year level color - Year line color Width line - Width of lines Style line - Style of lines
        AO AC Signal
        Pavel Shutovskiy
        The indicator displays signals of different indicators (which can be selected in parameters) on a chart when zero level is crossed. AO, AC or AO+AC if signals of two indicators coincide. The indicator shows an Alert message (pop-up window) when a signal appears. Parameters: Indicators - Selection of the indicator AO, AC, AO+AC. Bars - Number of bars in history for display of signals. Alert - Pop-up window in case of a signal.
        The indicator displays trend reversal in the form of arrows. The indicator does not change its values (is not redrawn) after a signal. The program notifies about arrows by means of a pop-up window, or sending notification to e-mail. This is a multitimeframe instrument. Values of the indicator may be displayed from higher timeframes. Parameters Time-frame - select time session; zero is the current timeframe (Time-frame cannot be lower than the current time interval). Bars - number of bars on the
        Beginning
        Pavel Shutovskiy
        The indicator builds levels from beginning of a week or a month, or according to local Highs and Lows. These levels are meant for detection of strong support and resistance levels on a chart. Most big players of the market are guided by particularly these data: opening of the week or opening of the month. Breakout of one or several Highs and price consolidation on these levels suggest that market intends to grow. Breakout of Lows and price consolidation bears evidence of market's intention to mo
        F trend
        Pavel Shutovskiy
        The indicator is designed for scalping fans, it gives signals of an average of ten pips. The indicator is based on mathematical calculation, it determines the average range of the price channel, which is generally formed at the time of accumulation of positions. Once the price moves beyond its borders, a signal is generated in the form of an arrow. The indicator has a minimum of settings: the period for which you need to calculate, and the frequency of signals (the signal frequency is determined
        Woltec
        Pavel Shutovskiy
        4 (1)
        The indicator has been developed for scalping. The indicator is based on a mathematical calculation that determines the percent range of the price channel, which is generally formed at the time of the accumulation of positions. Once the price moves beyond its borders, a signal is generated in the form of dots. The indicator has a minimum of settings - the frequency of signals. Smaller values produce more signals. Parameters: Multiplier - the frequency of signals (with lower values signals are m
        Jaguar tac
        Pavel Shutovskiy
        The indicator uses the Envelopes channel in its calculations, which allows working with dynamic support and resistance levels. It also considers the direction and strength of the trend, as well as the mathematical calculation that determines the percent range of the price channel, which is generally formed at the time of the accumulation of positions. It first generates a preliminary signal in the form of a round arrow. Then it is necessary to wait for a normal arrow and enter the market only af
        ADX trend
        Pavel Shutovskiy
        This indicator displays the signals of the ADX indicator (Average Directional Movement Index) as points on the chart. This facilitates the visual identification of signals. The indicator also features alerts (pop-up message boxes) and sending signals to e-mail. Parameters Period - averaging period. Apply to - price used for calculations: Close, Open, High, Low, Median (high+low)/2, Typical (high+low+close)/3, Weighted Close (high+low+close+close)/4. Alert - enable/disable alerts. EMail - enable
        ADX arrow N
        Pavel Shutovskiy
        ADX arrow Cet indicateur affiche les signaux de l'indicateur ADX (Indice de Mouvement directionnel Moyen) sous forme de points sur le graphique. Cela facilite l'identification visuelle des signaux. L'indicateur comporte également des alertes (boîtes de messages contextuelles) et l'envoi de signaux par courrier électronique. Paramètre: Period  - période de moyenne. Apply to  - prix utilisé pour les calculs: Close, Open, High, Low, Median (high+low)/2, Typical (high+low+close)/3, Weighted Clos
        ATR Pivots
        Pavel Shutovskiy
        The indicator calculates intraday levels based on the average daily price range, builds support and resistance levels that may be reversal. Parameters Period ATR - period of the ATR indicator Shift time - time offset for the opening of the day Color opening of day - color of the opening line of the day Color 1AR, -1AS - line color 1AR, -1AS Color AR 1/2, AS -1/2 - line color AR 1/2, AS Color AR 1/4, AS -1/4 - line color AR 1/4, AS -1/4 Color AR 3/4, AS -3/4 - line color AR 3/4, AS -3/4 Color
        Filtrer:
        Andrzej Swietochowski
        133
        Andrzej Swietochowski 2021.03.08 12:52 
         

        It's wasted money. The signal keeps shifting. This program cannot be trusted. The program repaints its signals. Don't buy it - it's a waste of time and a waste of your money. I haven't seen anything worse. The seller should refund your money for this. You can't build a strategy because no one knows when the signal was in the past, and these past signals shown - are repainted, changed. He even repaints 1 indicator.

        Dine Scalpers
        51
        Dine Scalpers 2019.02.07 21:48 
         

        Amazing Service - I was having trouble setting it up and Pavel very quickly sent me 3 different "set" files to load into the indicator and it is doing what it's supposed to do. Definitely worth it.

        UPDATE: Having a little concern at the moment since after testing this product much more intently. If you are okay with repainting programs, then this is for you. I am currently using it in the most basic of forms and just wanted to know when the Main Line crosses the Signal Line when above 80% or below 20% for a fast and medium setting in the same time frame. This is a definitive point in time when using a candle closed condition. However, after it shows this, it continues to move the "Suggestion" arrow as the chart "flat lines" and there is not much movement either way, removes the suggested trade arrow if it begins reversing on you, and then also moves the arrow down to the optimal point when it does finally go up in the direction originally shown.

        In Conclusion, if you are sitting there at your charts, it typically will provide an alert at the correct time but, unfortunately it tries to make things look prettier than they really are by repainting to the perfect spot. I have put in a request to see if this failing feature of so many programs that can absolutely mess up a strategy can be deleted and based on that, we will look into adjust the star rating.

        Dine

        Répondre à l'avis