MACD Standard and Hidden Divergences
- Indikatoren
- Version: 1.2
- Aktualisiert: 27 November 2018
- Aktivierungen: 5

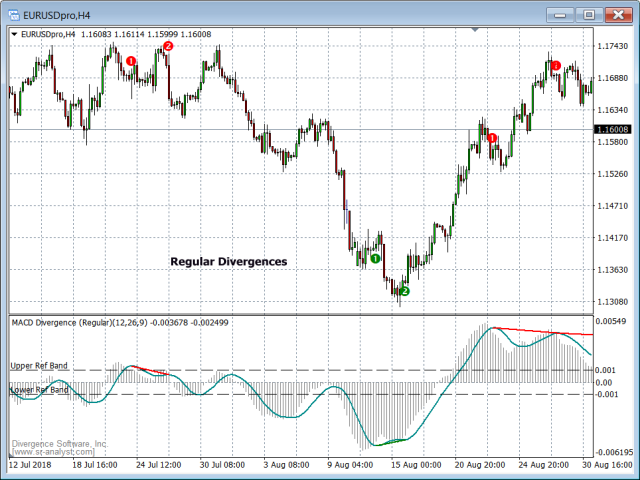
Der MACD Standard/Hidden Divergence-Indikator stellt den MACD dar und identifiziert und zeichnet auch Standard-Divergenzen (reguläre Divergenzen) zwischen dem Indikator und dem Kursverlauf, ODER er kann so eingestellt werden, dass er versteckte Divergenzen (umgekehrte Divergenzen) zwischen dem Indikator und dem Kursverlauf identifiziert und zeichnet. Die Divergenzen selbst werden als Linien (standardmäßig grün für bullische Divergenzen und rot für bärische Divergenzen) im Indikatorfenster dargestellt. Wenn Sie diese Option im Dialogfeld Eingaben aktivieren, werden Warnmeldungen generiert, sobald eine neue Divergenz identifiziert oder eine bestehende Divergenz erweitert wird.
Es gibt auch eine Option, mit der die Divergenzen im Preisfenster hervorgehoben werden können. Wenn diese Option ausgewählt ist, werden Formen über den Höchstständen der Balken gezeichnet, die den Anfangs-/Endpunkt einer oberen (bärischen) Divergenz identifizieren, und umgekehrt für untere (bullische) Divergenzen. Sie können wählen, ob Sie alle Divergenzen oder nur die jüngste Divergenz hervorheben möchten.
Eine Divergenz ist oft ein Vorbote für eine Kursumkehr. Bei einer zinsbullischen (regulären) Divergenz erreicht der Kurs niedrigere Tiefststände, während der verfolgte Indikator höhere Tiefststände erreicht, was in der Regel auf eine Verringerung (oder Umkehrung) der Dynamik hinweist. Das Gegenteil ist der Fall bei einer (regulären) Baisse-Divergenz.
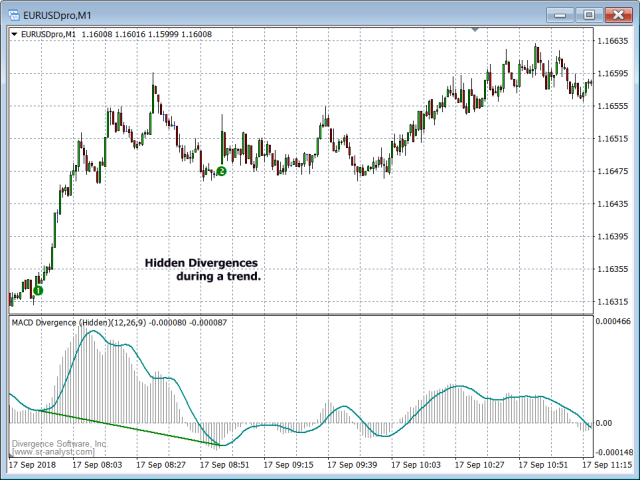
Wenn sich ein Wertpapier in einem starken Trend befindet, neigen regelmäßige Divergenzen dazu, eine Reihe von Fehlsignalen zu erzeugen. In dieser Situation können versteckte Divergenzen zur Identifizierung von Einstiegs- bzw. Wiedereinstiegspunkten genutzt werden. Eine bullische (versteckte) Divergenz tritt auf, wenn der Kurs einen höheren Tiefpunkt erreicht, während der Indikator einen niedrigeren Tiefpunkt erreicht. Das Gegenteil ist der Fall bei einer (versteckten) Baisse-Divergenz.
Divergenzen können zwar zur Generierung von Einstiegssignalen verwendet werden, die meisten Händler nutzen sie jedoch zur Bestätigung eines anderen Handelssignals. Wie bereits erwähnt, sollten Sie bei einem Wertpapier, das sich in einem Trend befindet, nach versteckten Divergenzen Ausschau halten, während Sie sich zu allen anderen Zeiten auf reguläre Divergenzen konzentrieren sollten.
Fast jeder Oszillator kann zur Erkennung von Divergenzen verwendet werden, aber es gibt bestimmte Indikatoren, die bei dieser Aufgabe effektiver sind, darunter der CCI, RSI, Momentum, Stochastik und MACD. Wir bieten für alle diese Indikatoren Versionen zur Divergenzprüfung an.
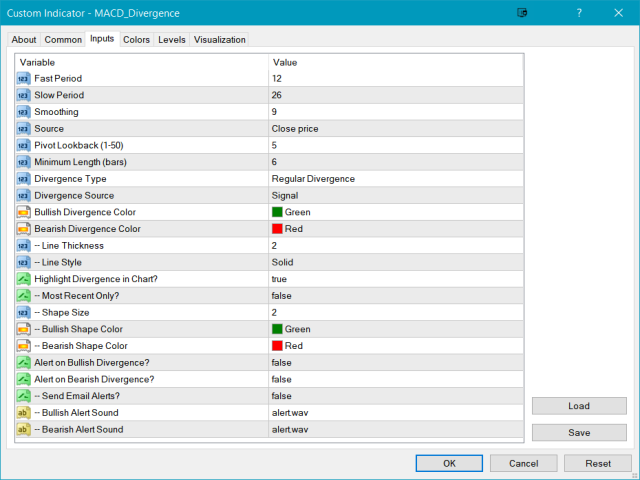
Das Menü Eingaben bietet die volle Kontrolle über die zugrundeliegenden Indikatorparameter sowie alle divergenzspezifischen Eigenschaften und Kosmetika.
| Menü Option | Beschreibung |
|---|---|
| Schnelle Periode | Legen Sie die Fast-Periode für die MACD-Berechnung fest. Die Voreinstellung ist 12. |
| Langsame Periode | Legen Sie die langsame Periode für die MACD-Berechnung fest. Die Voreinstellung ist 26. |
| Glättung | Legen Sie die Glättungsperiode für die MACD-Berechnung fest. Die Voreinstellung ist 9. |
| Quelle | Wählen Sie die Quelle für die Preiseingabe. Standardwert ist Close. |
| Pivot-Rückblick | Legen Sie die Anzahl der Pivots fest, über die Divergenzen gescannt werden sollen. Standardwert ist 5, der Bereich ist 1-50. |
| Mindestlänge | Legt die Mindestlänge in Takten für eine gültige Divergenz fest. Die Vorgabe ist 6. |
| Divergenz-Typ | Wählen Sie aus Reguläre Divergenz und Versteckte Divergenz. |
| Farbe der bullischen Divergenz | Legen Sie die Farbe für bullische Divergenzlinien fest. |
| Farbe der Baisse-Divergenz | Legen Sie die Farbe für bärische Divergenzlinien fest. |
| --Linienstärke | Legen Sie die Linienstärke für Divergenzlinien fest. Der Bereich reicht von 1 bis 6. Die Voreinstellung ist 2. |
| -Linienstil | Legt den Linienstil für Divergenzlinien fest. Die Voreinstellung ist Durchgehend. |
| Divergenz im Diagramm hervorheben? | Wahr oder Falsch. Wenn True, werden die Anfangs- und Endpunkte der Divergenzen im Preisfenster hervorgehoben. |
| --Nur aktuellste? | Wahr oder Falsch. Bei True wird nur die jüngste Divergenz im Preisfenster hervorgehoben. |
| -Größe der Form | Legen Sie die Größe der Form fest, die beim Hervorheben von Divergenzen verwendet werden soll. |
| --Bullish Shape Farbe | Legen Sie die Farbe fest, mit der bullische Divergenzen hervorgehoben werden sollen. |
| --Farbe der bärischen Form | Legen Sie die Farbe fest, die zur Hervorhebung von bärischen Divergenzen verwendet werden soll. |
| Warnung bei bullischer Divergenz? | Wahr oder Falsch. Bei True werden Alarme für bullische Divergenzen generiert. |
| Warnung bei bärischer Divergenz? | Wahr oder Falsch. Bei True werden Alarme für bärische Divergenzen generiert. |
| --E-Mail-Warnungen senden? | Wahr oder Falsch. Bei True werden neben dem Standard-Audio-Alarm auch E-Mail-Warnungen generiert. |
| -Bullish-Alarm-Ton | Legen Sie die WAV-Datei fest, die für bullische Alarme verwendet werden soll. |
| --Bearish-Alarm-Ton | Legen Sie die WAV-Datei fest, die für Baisse-Warnungen verwendet werden soll. |