MESA Spectrum
- Indicadores
- Versión: 1.4
- Actualizado: 4 octubre 2018
- Activaciones: 5

El indicador Espectro MESA calcula el espectro de potencia de una serie de datos utilizando el método de Estimación del Espectro de Máxima Entropía y produce un gráfico del espectro de potencia. El algoritmo de máxima entropía, a diferencia de una simple transformación FFT, incluirá frecuencias de todo el plano de frecuencias complejo y no sólo del intervalo de Nyquist, lo que, en términos generales, significa que puede resolver períodos de ciclo mayores que la ventana de datos pasada a la función. Además, MESA tiene la capacidad de ajustar características espectrales muy nítidas que otros métodos de análisis suelen pasar por alto.
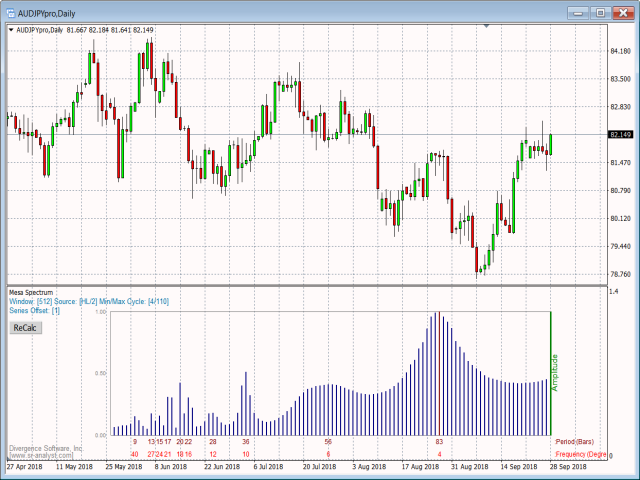
El espectro de potencia mostrado resaltará los ciclos y frecuencias dominantes dentro de los datos y mostrará el Periodo y la Frecuencia debajo de cada pico.
Antes de pasar al algoritmo MESA, el logaritmo de los datos de precios se detrae utilizando un filtro de mínimos medios cuadrados.
Si experimenta con esta herramienta, descubrirá rápidamente que la mayoría de las series temporales financieras tienen sus mayores amplitudes en el extremo inferior del espectro de frecuencias y que la mayoría de estos ciclos "dominantes" son demasiado largos para ser utilizados en operaciones a corto plazo. El script dispone de dos filtros de visualización que pueden aplicarse (Límite superior del ciclo y Límite inferior del ciclo) en los que puede introducir un límite superior e inferior del periodo del ciclo. Esto le permite ignorar efectivamente las frecuencias muy altas y/o muy bajas para que pueda concentrarse en encontrar ciclos dentro de un rango de periodo que tenga sentido para su estilo de negociación. Además, puede seleccionar el tamaño de la ventana para el análisis del ciclo, establecer la fuente del precio de entrada y especificar el desplazamiento de los datos de entrada.
Los periodos se calculan como el número de barras necesarias para completar un ciclo y las frecuencias se calculan como el número de grados de cambio por barra.
P = Barras por ciclo;
F = 360/P (360 grados divididos por el periodo)
Un valor F alternativo puede calcularse como número de ciclos en el periodo de datos N:
F = N/P.
La información espectral puede utilizarse como base para un trabajo adicional de estudio de ciclos o para afinar diversos osciladores e indicadores. El enfoque típico consiste en utilizar el espectro de potencia para identificar el ciclo dominante en los datos y, a continuación, ajustar la media móvil o el oscilador a un periodo que sea la mitad del ciclo dominante.
Opciones:
| Menú Opción | Descripción |
|---|---|
| Tamaño de la Ventana | Seleccione entre 1024, 512, 256 o 128. Generalmente se recomienda el tamaño de ventana 512 o 256. El valor predeterminado es 512. |
| Fuente | Seleccione la fuente de entrada de precios. El valor predeterminado es Precio medio. |
| Desplazamiento de datos | Establece el desplazamiento en la serie de precios. Por defecto es 1 (bar). |
| Límite superior de ciclo | Seleccione la mayor longitud de ciclo aceptable. Por defecto es 110. El rango es 1-512. |
| Límite inferior de ciclo | Seleccione la menor longitud de ciclo aceptable. El valor predeterminado es 4. El intervalo es 1-512. |
| Color del espectro (reg) | Establece el color del gráfico del espectro. |
| Color del espectro (máx) | Establezca el color para resaltar el ciclo dominante. |
| Espectro (marco) Color | Establece el color para el marco del espectro. |
| Leyenda del espectro 1 Color | Establece el color para la leyenda del periodo. |
| Leyenda Espectro 2 Color | Establece el color para la leyenda de Frecuencia. |
| Color del cuadro de información | Defina el color del cuadro de información que aparece debajo del título. |