Indicator for M15 TimeFrame
- Indikatoren
- Version: 5.8
- Aktualisiert: 20 November 2021
- Aktivierungen: 5

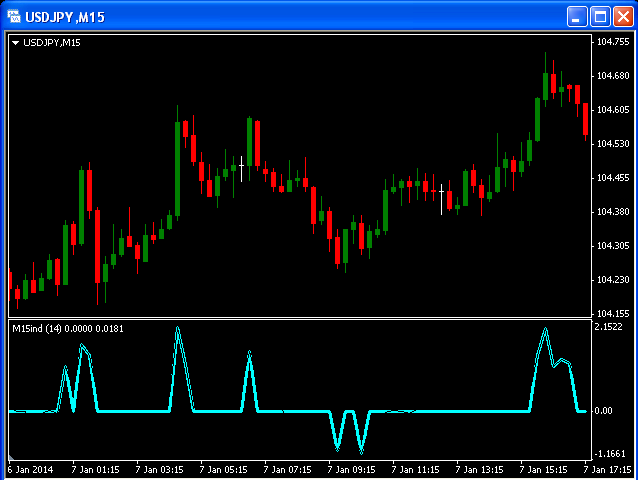
Dieser Indikator wurde für einen M15-Zeitrahmen erstellt.
Die Nulllinie bedeutet einen flachen Markt ( ein flacher Markt kann sich auf einenHandel beziehen, bei dem sich das Währungspaar nicht signifikant nach oben oder unten bewegt hat und daher der Devisenhandelsposition kein großer Gewinn oder Verlust zugeschrieben wird. In der Regel handeln Händler nicht, wenn der Markt flach ist).
Die positiven und negativen Impulse zeigen entsprechend die Long- und Short-Bewegungen an.