Indicator for M15 TimeFrame
- Indicadores
- Versión: 5.8
- Actualizado: 20 noviembre 2021
- Activaciones: 5

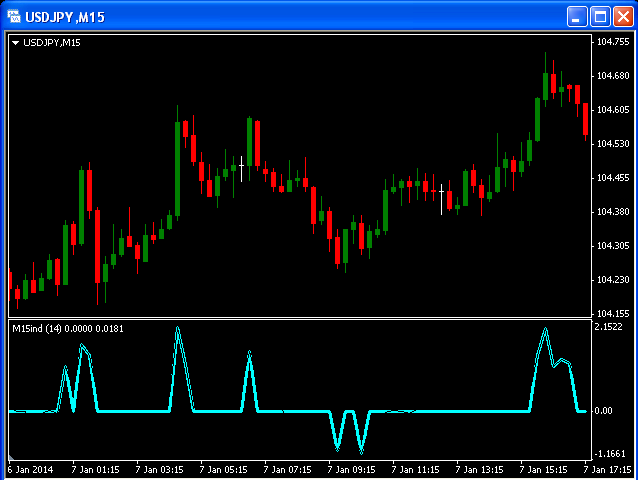
Este indicador fue creado para un marco de tiempo M15.
La Línea Cero significa un mercado plano ( Un mercado plano puede referirse a unaoperación en la que el par de divisas no se ha movido significativamente hacia arriba o hacia abajo y , por lo tanto, no tiene grandes ganancias o pérdidas atribuidas a la posición de comercio de divisas. Por lo general, los operadores no operan cuando el mercado está plano).
Los impulsos positivos y negativos indican los movimientos Largo y Corto en consecuencia.