Dashboard RSI Multi Time Frame for MT5
- Indikatoren
- Version: 1.0
Ein nützliches Dashboard, das die RSI-Werte für mehrere Symbole und Zeitrahmen anzeigt.
Es kann mit einem einfachen Klick auf das X oben links im Dashboard ein- und ausgeblendet werden.
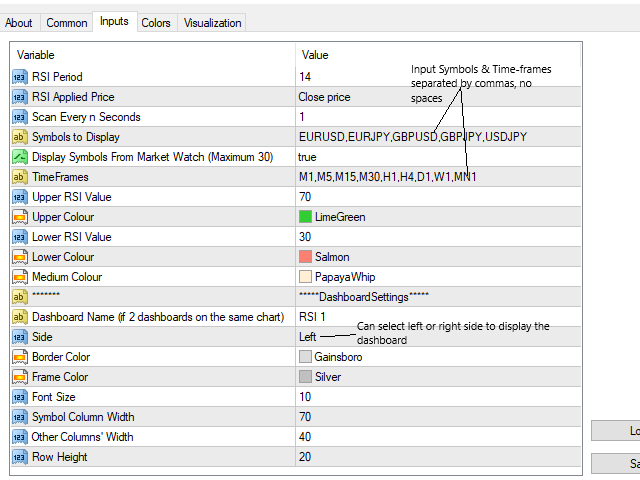
Sie können obere und untere RSI-Werte eingeben, und die Farben können so eingestellt werden, dass sie angezeigt werden, wenn sie über oder unter diesen Werten liegen. Die Standardwerte sind 70 und 30.
Sie können wählen, ob das Dashboard auf der rechten oder linken Seite des Diagramms angezeigt werden soll.
Wenn Sie 2 Dashboards auf demselben Diagramm haben möchten, müssen Sie für jedes einen anderen Namen eingeben.
Der Scan ist auf einen Timer eingestellt, der standardmäßig alle 3 Sekunden aktiviert wird. Sie können in den Eingaben einen anderen Zeitraum einstellen.
Symbole und Zeitrahmen werden durch Kommas getrennt eingegeben.
Dieser Indikator verwendet nur Standard-Zeitrahmen, d.h. M1,M5,M15,M30,H1,H4,D1,W1,MN1.
Die Symbole können auch aus dem Market Watch-Fenster geladen werden. Wenn es mehr als 30 Symbole gibt, werden nur die ersten 30 geladen.
Wichtig
Ich empfehle Ihnen, dieses Dashboard nur mit Symbolen und Zeitrahmen zu verwenden, mit denen Sie normalerweise arbeiten.
Die iCustom-Handles werden bei der Initialisierung eingerichtet, und das kann ein Problem sein, wenn die Historie für das Symbol und den Zeitrahmen nicht auf dem neuesten Stand ist.
In diesem Fall wird der Indikator nicht initialisiert und Sie müssen ihn neu starten. Auf der Registerkarte Experten wird ein Bericht für das Symbol und den Zeitrahmen angezeigt, für die das Abrufen des Handles fehlgeschlagen ist.
Wenn das Abrufen des Handles für dasselbe Symbol immer wieder fehlschlägt, sollten Sie den Chart öffnen und überprüfen, ob genügend Historie vorhanden ist. Falls nicht, löschen Sie es aus der Liste.


Wonderful product. Use it for my trade setups.