Smoothing Oscillator Bands
- Indikatoren
- Version: 2.11
- Aktivierungen: 5

Wie alle Momentum-Indikatoren misst dieser Oszillator die Geschwindigkeit und Veränderung der Kursbewegung.
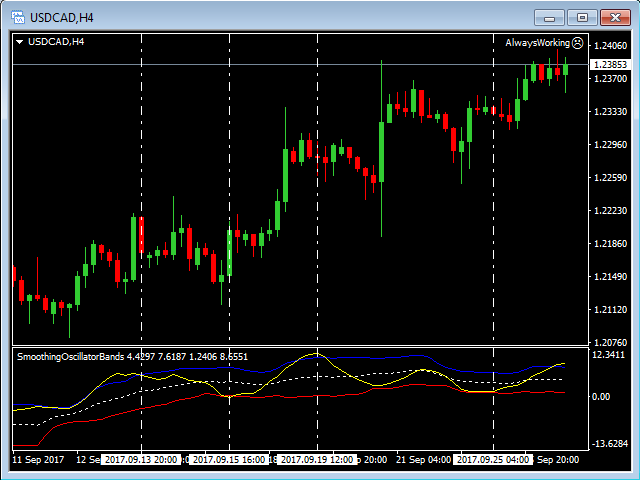
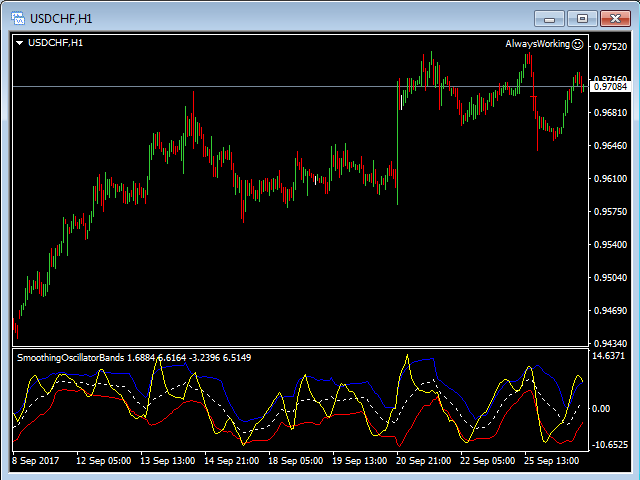
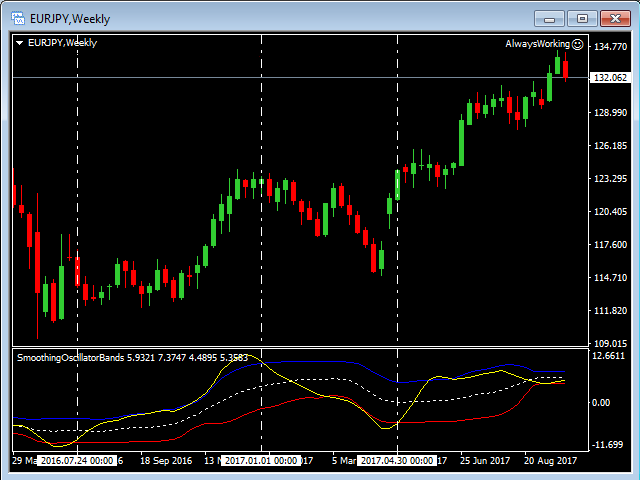
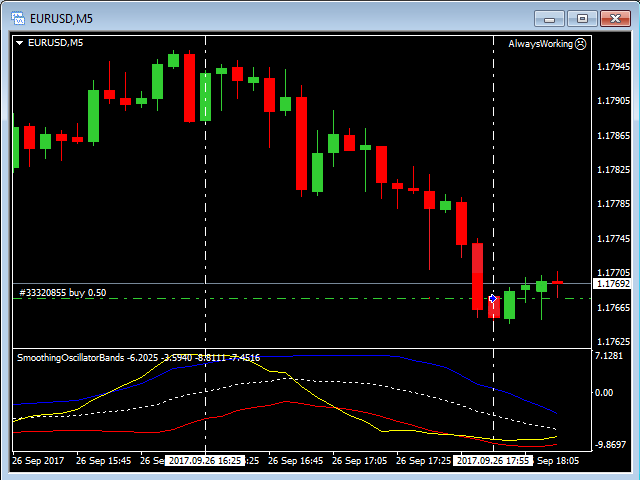
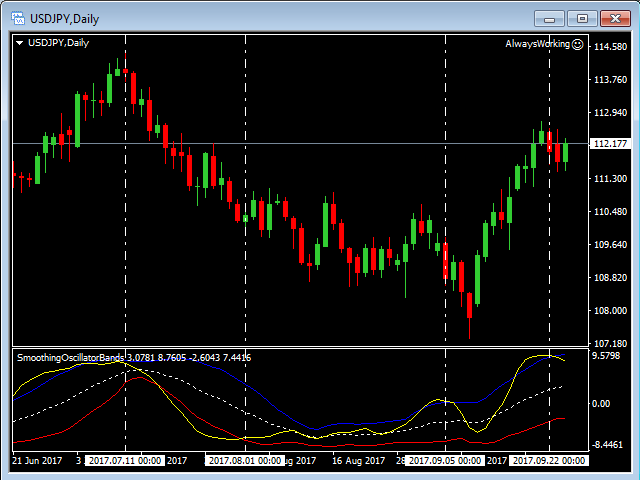
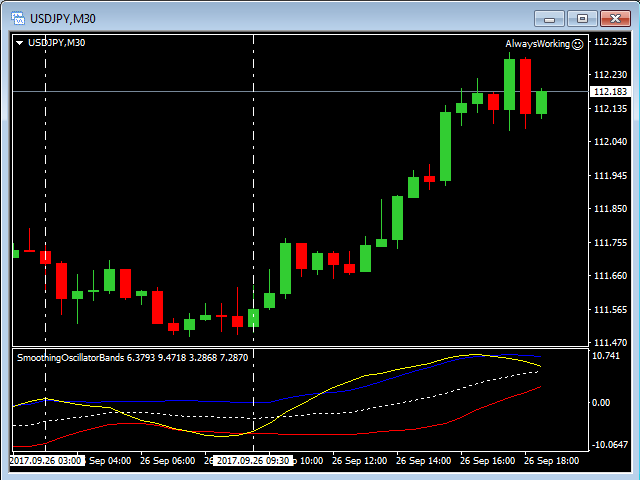
Der Momentum-Indikator verwendet überkaufte und überverkaufte Bedingungen. Der SmoothingOscillatorBands-Indikator verwendet ein Kurvenband, um diese Bedingungen anstelle von konstanten Werten anzuzeigen. Wenn die gelbe Linie über der blauen Linie liegt, haben wir eine überkaufte Situation, und wenn die gelbe Linie unter die blaue Linie ausbricht, haben wir eine gute Gelegenheit, zu verkaufen. Wenn die gelbe Linie unter einer roten Linie liegt, haben wir einen überverkauften Zustand und wenn die gelbe Linie über die rote Linie ausbricht, haben wir eine gute Gelegenheit, zu kaufen.
- Die gelbe Linie ist eine Oszillator-Hauptlinie des Indikators.
- Die rote Linie ist eine Widerstandslinie.
- Die blaue Linie ist eine Unterstützungslinie.
- Die weiß gepunktete Linie ist eine Mittellinie.