OHLC Indicator by PipTick MT4
- Indicadores
-
Michal Jurnik
 "Talent is cheaper than table salt. What separates the talented individual from the successful one is a lot of hard work." - Stephen King. Those few words reflect myself very well. I am probably not the most talented developer in the world but I truly believe in hard work, professional attitude and
 - Versión: 1.3
- Actualizado: 1 diciembre 2021
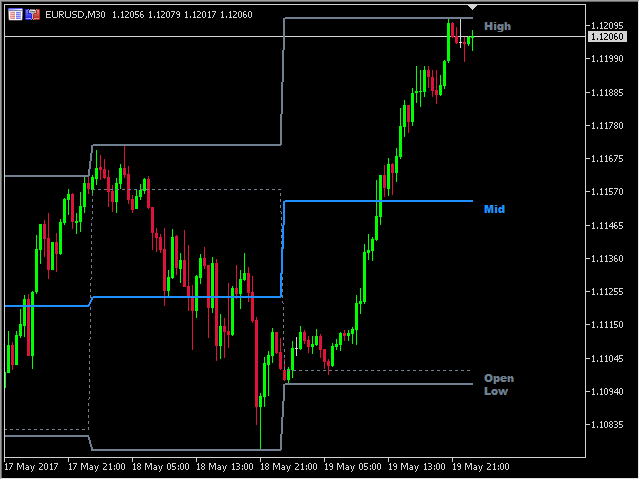
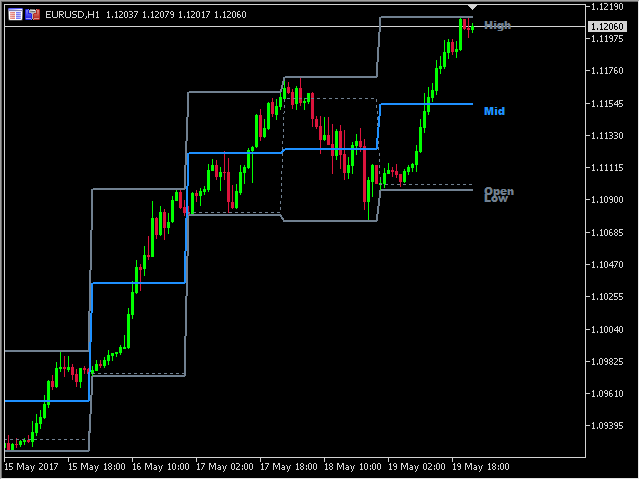
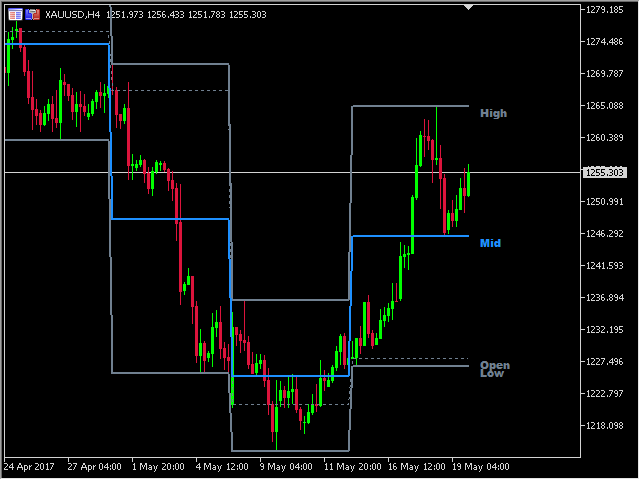
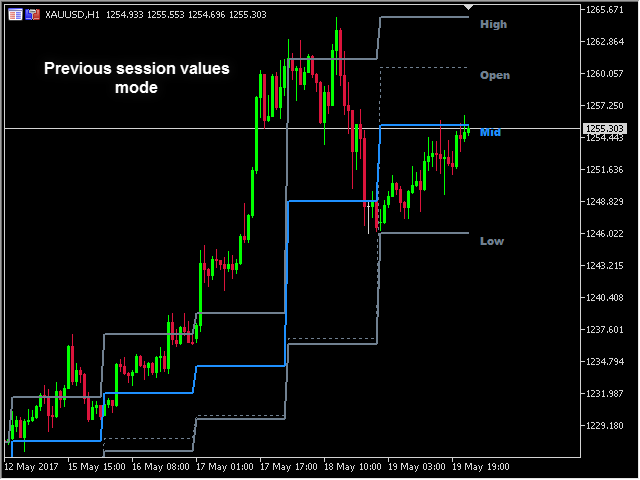
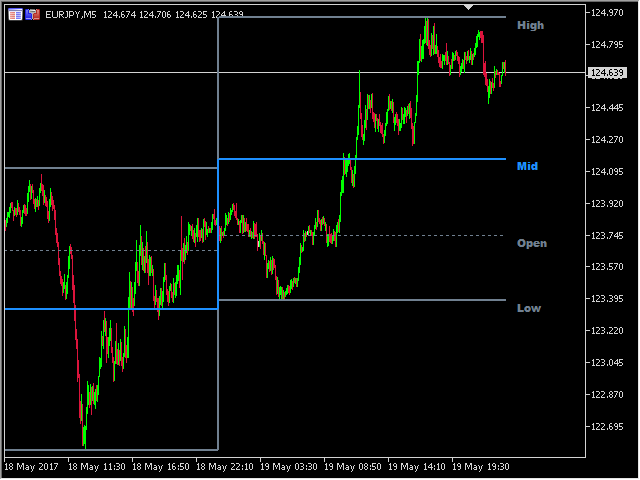
Elindicador OHLC muestra los valores actuales e históricos de Máximo, Mínimo, Apertura, Cierre y Media para un periodo de tiempo específico. Puede representar los valores actuales o los valores de la sesión anterior. El rango del indicador puede calcularse a partir de una sesión diaria, semanal, mensual o especificada por el usuario.
Niveles
- Máximo de la sesión actual o anterior.
- Mínimo de la sesión actual o anterior.
- Apertura de la sesión actual o anterior.
- Cierre de la sesión actual o anterior.
- Punto medio de la sesión actual o anterior.
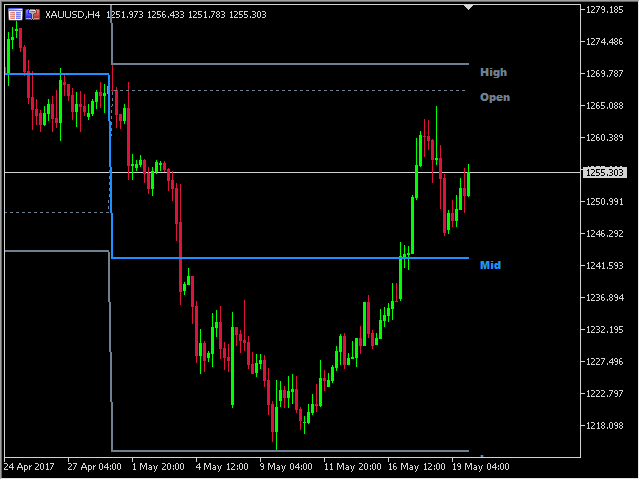
Recomendaciones
- Utilizar los valores de sesión anterior de Máximo, Mínimo, Cierre y Medio es beneficioso para los niveles de soporte y resistencia. Suele funcionar muy bien.
Características principales
- El indicador muestra los niveles actuales de Máximo, Mínimo, Apertura, Cierre y medio.
- Valores actuales o de la sesión anterior.
- Notificaciones de alerta para las líneas del indicador.
- Tiempo de sesión personalizado.
- Funciona en todos los marcos temporales (M1, M5, M15, M30, H1, H4, D1, W1, MN).
- El indicador no repinta.
- Listo para backtesting.
- Parámetros personalizables (Colores, Grosor de línea, Visibilidad...).
- Alta velocidad de cálculo.
- Disponible para MT4 y MT5.
Por favor visite la página de productodel indicadorOHLC para la configuración de los parámetros de entrada y salida.


Awesome Indicator