Breakout Range
- Indikatoren
- Version: 1.30
- Aktualisiert: 22 November 2021
- Aktivierungen: 5
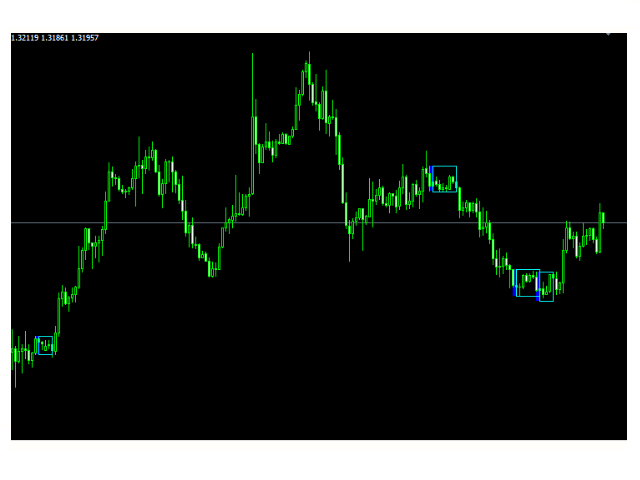
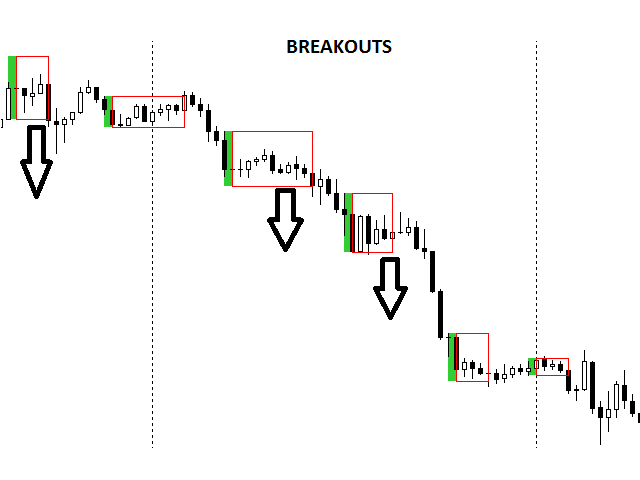
Dies ist ein einfacher und effizienter Indikator, der auf Marktlogik basiert. Der Indikator erstellt einen vom Händler gewählten Bereich.
Der Händler wählt nur zwei Parameter aus.
Der erste ist die Anzahl der Kerzen, die den Rahmen definieren.
Der zweite Parameter ist die Anzahl der Kerzen, die für den Bestätigungsrahmen benötigt werden.
Der Indikator zeigt alle Situationen in der Geschichte an und arbeitet mit der tatsächlichen Bewegung des Marktes.
Der Indikator funktioniert auf allen Zeitrahmen. Sie sind nicht durch die Verwendung verschiedener Zeitrahmen eingeschränkt, der Indikator ist in der Lage, sich anzupassen. Auf den Screenshots können Sie die Grundeinstellungen sehen.
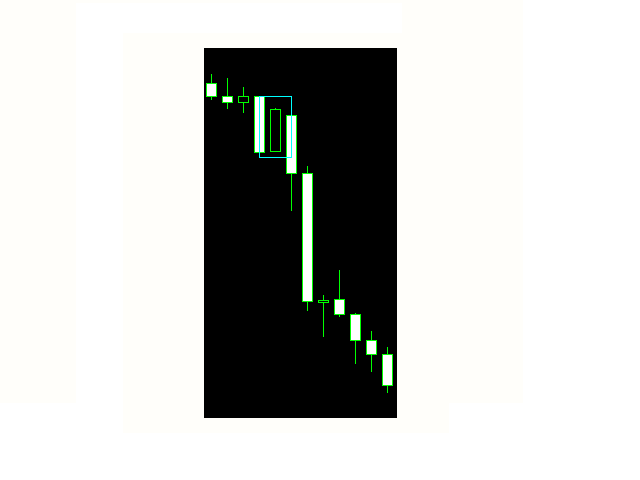
Beispiel-Einstellung
1; 1
Dies ist eigentlich ein Inside Bar.
1 Hauptkerze, 1 Kerze muss innerhalb der vorherigen Kerze liegen. Einfach...
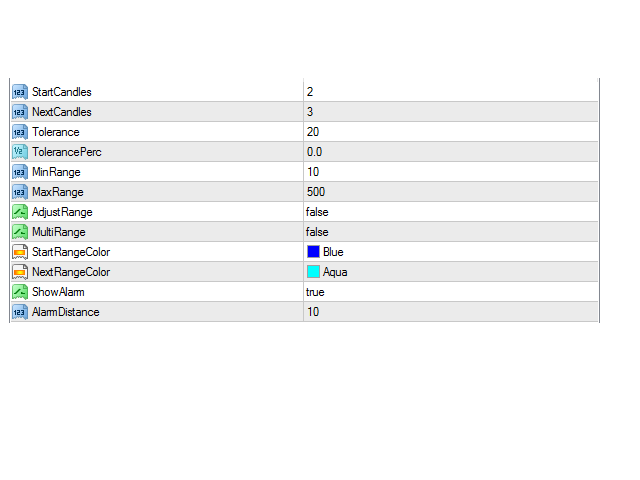
Parameter
- StartCandles - Anzahl der Kerzen, die einen imaginären Rahmen bilden (Größe)
- NextCandles - Anzahl der Kerzen, die sich innerhalb des imaginären Rahmens befinden müssen, der aus den "StartCandles" gebildet wird
- Tolerance - Toleranz in Punkten
- TolerancePerc - Toleranz in Prozent vom Rahmen
- MinRange - minimale Größe des Rahmens
- MaxRange - maximale Größe des Rahmens
- AdjustRange - Vergrößerung des Rahmens (die nächsten Kerzen können den imaginären Rahmen mit der gewählten Toleranz leicht überschneiden und dank AdjustRange wird die Größe des Rahmens um den Grad der Überschneidung erhöht)
- MultiRange - Möglichkeit, mehrere Rahmen ineinander zu ziehen
- Start/Nächster Bereich Farbe - Farbe
- ShowAlarm - wahr/falsch
- AlarmDistance - wie viele Punkte nach dem Schnittpunkt des Bereichs ertönt der Alarm