Breakout Range

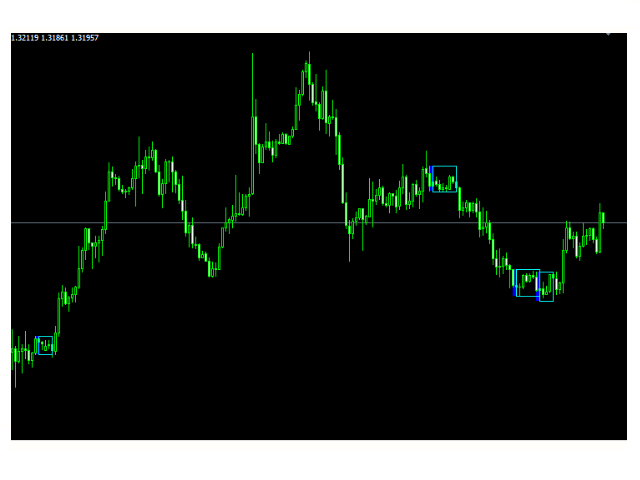
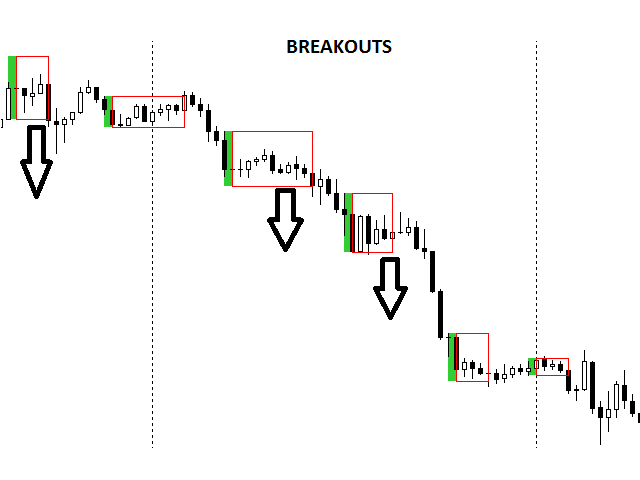
This is a simple and efficient indicator based on market logic. The indicator creates a range chosen by a trader.

Trader selects only two parameters.

The first one is the number of candles that define the frame.

The second one is the number of candles needed for confirmation frame.

The indicator shows all situations in history and works with the actual movement of the market.

The indicator works on all timeframes. You are not limited by use of different timeframes, the indicator is able to adapt. On the screenshots, you can see basic settings.
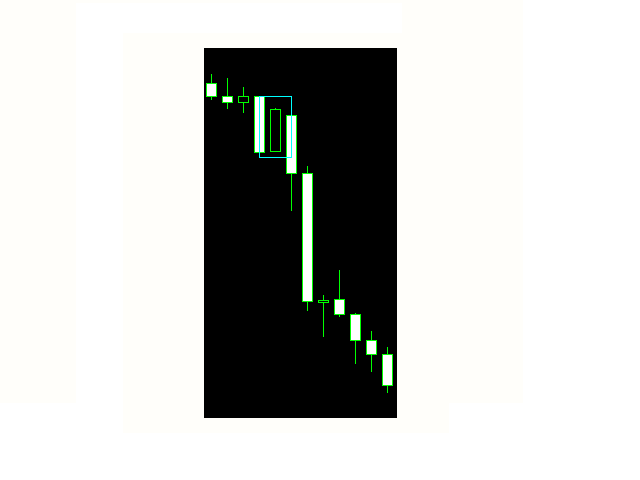

Example setting

1; 1

This is actually an Inside Bar.

1 main candle, 1 candle must be inside the previous one. Simple...
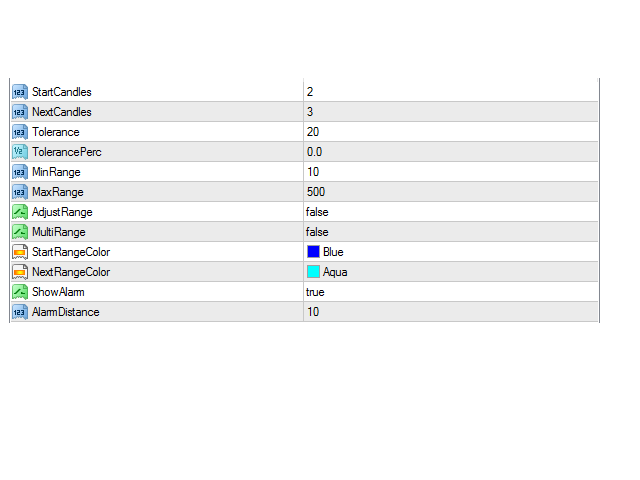

Parameters

  • StartCandles - number of candles which create an imaginary frame (size)
  • NextCandles - number of candles which have to be inside the imaginary frame that is created from "start candles"
  • Tolerance - tolerance in points
  • TolerancePerc - tolerance in percent from the frame
  • MinRange - minimal size of the frame
  • MaxRange - maximum size of the frame
  • AdjustRange - enlarging the frame (next candles can mildly intersect the imaginary frame by chosen tolerance and thanks to Adjust Range, the size of the frame will increase by degree of intersection)
  • MultiRange - possibility of more frames drawn into each other
  • Start/Next Range Color - color
  • ShowAlarm - true/false
  • AlarmDistance - how many points after the intersection of range the alarm sounds
おすすめのプロダクト
フィボナッチ・トレンド・マーカー (Fibonacci Trend Marker) は、現在のローソク足が過去のローソク足の高値-安値(High-Low、HL)範囲に対してどのように振る舞うかを、フィボナッチ・リトレースメントレベルを用いて分析するトレンド指標です。トレンドの強さを視覚的に追跡し、ローソク足の色の変化を通じてトレンドの弱まりや反転の可能性を示します。 特徴: トレンド重視のトレーダーのために設計されており、フィボナッチレベルに基づいてトレンドの変化を素早く検出します。 市場のボラティリティが十分で、3~5本のローソク足が明確な動きを形成する場合、あらゆる時間枠で有効です。 ローソク足のサイズはチャートのスケールに自動的に適応し、ズーム時にも正確な表示を保証します。 現在のローソク足をリアルタイムで分析することでトレンド変化に高い感度を持ち、M1やM5の時間枠でのスキャルピングに最適です。 取引方法: エントリー: 前の閉じたローソク足の色が変化した後にポジションを開きます。例えば、赤いローソク足の後に青で閉じた場合、上昇トレンドのシグナルとなり、買い(Buy)の取引
Signal Eskiya, in addition to channel lines, reflects entry signals in the form of arrows. Trading strategies using the channel indicator belong to the classic methods of technical analysis, are easy to execute, and therefore available even to beginners. Price ranges work equally well on any trading assets and timeframes, they can be used both independently and with additional confirmation from oscillators and market volumes. American traders say: “Trend is your friend”, which means “Trend is
MetaTrader 5用スマートピボットポイント — スマートな取引のための明確なレベル スマートピボットポイントは、MetaTrader 5用のプロフェッショナルインジケーターです。チャート上に主要な取引レベルを自動計算し、表示します。混沌とした価格変動を、明確な構造化されたマップに変換し、サポート、レジスタンス、価格バランス、そして潜在的なターゲットゾーンをハイライトします。明瞭性を重視するトレーダーのために設計されたこのツールは、FX、仮想通貨(ビットコイン、イーサリアム)、株価指数、株式、コモディティ(XAUUSD)など、あらゆる市場で機能します。 このインジケーターは、計算時間を節約し、分析に客観性をもたらす、信頼できる分析アシスタントです。市場シグナルを提供したり、代わりに意思決定を行うわけではありませんが、情報に基づいた独自の取引判断のための高品質な情報基盤を提供します。 主な機能とメリット すぐに使える価格座標システム:もう手動でレベルを描く必要はありません。中心レベル(バランス)、サポート、レジスタンス、買いターゲット、売りターゲットの5本の明確なラインがチャ
Moving pivot Average Fibonacci The  indicator compares the selected period with its counterpart from the previous period. The indicator determines the moving Fibonacci levels for the day or any time interval to assess the price movement range from the time average. The indicator helps predict the expected high or low for the day based on historical time data. The pivot line can be considered an average trend line and use it in a variety of trading strategies. If you have any question about the
Optimized for Asia- London- US- Open-Session  the best Features from MOMENTUM-SOLO true Momentum - time-based Indicator it's based on a self-developed candle Pattern, in relation to the ATR Filter Daytime Weekdays Moving Averages Keltner-Channel MACD Advantages Optimised for Asia- London- US- Open-Session choose your personal times to trade - select Daytime and Weekdays Keltner-Channel => to reduce market noise - sideways movement will be hidden 3x Moving Averages => for the Trend,
外国為替トレーダーであれば、テクニカル分析における フィボナッチ 取引戦略の威力を理解しているでしょう。ただし、フィボナッチ レベルを手動で描画および調整するには時間がかかる場合があります。そこで、貴重な時間を節約するために Fibonacci Of Yesterday EA が登場します。前日の価格変動に基づいたフィボナッチ戦略を使用した取引専用に設計されており、この革新的なツールはフィボナッチレベルに基づいてエントリー、ストップロス、テイクプロフィットレベルの識別を自動化します。この自動化により、取引プロセスが合理化され、効率が向上します。この EA には、最新のトレーリング システムと包括的なリスク管理システムも備えており、取引を効果的に管理するのに役立ちます。 Fibonacci Of Yesterday EA を使用すると、特定されたフィボナッチ レベルに基づいて取引を迅速に開始および終了することで、迅速な市場活動を活用できます。さらに、EA は通知アラートを提供し、取引プラットフォームから離れているときでも市場の動きに関する情報を提供します。 Fibonacci Of
NO REPAINT ADVANCED CHART PATTERN INDICATOR By definition, a price ( chart)  pattern is a recognizable configuration of price movement that is identified using a series of  trendlines  and/or curves. When a price pattern signals a change in trend direction, it is known as a reversal pattern; a continuation pattern occurs when the trend continues in its existing direction following a brief pause. Advanced Chart Pattern Tracker is designed to find the MOST ACCURATE patterns. A special script is a
Indicador de Fibonacci Semanal para MT4 Maximize suas operações no mercado financeiro com o Indicador de Fibonacci Semanal para MetaTrader 4 (MT4) , a ferramenta essencial para traders que buscam identificar pontos estratégicos de suporte e resistência com base na ação do preço da última semana. Principais Recursos: Atualização Automática : O indicador recalcula os níveis de Fibonacci automaticamente a cada novo candle semanal. Níveis Personalizados : Traça apenas os níveis essenciais de Fibonac
OBTE = Order Block Type I OBTI Indicator MT4 is the most accurate and customizable indicator on the market. It was developed to facilitate the analysis of operations based on candlestick patterns and supply-demand zones. These zones are possible movement reversal points. For this indicator is generated by the order block of smart money concept. Input parameters: 1. Multiple timeframes : M1 M5 M15 M30 H1 H4 D1 W1 MN1 2. Default input: H1 H4 D1 W1 MN1 3. Notifications / Send Emails / Notification
スペシャルオファー : ALL TOOLS 、1つあたり $35 のみ! New tools   will be   $30   for the   first week   or the   first 3 purchases !  Trading Tools Channel on MQL5 : Join my MQL5 channel to update the latest news from me ボラティリティの高いトレード環境では、パワフルで直感的な分析ツールがあれば、チャンスを素早く捉えることができます。Fibonacci Trend Scanner は従来のFibonacciインジケーター機能とSuperTrendを統合しただけでなく、通貨ペアのスキャン、マルチタイムフレームのモニタリング、そしてトレンドが強気から弱気へ(またはその逆)転換する際にインテリジェントアラートを出す機能など、機能を拡張しています。 See more MT5 version at:   Fibonacci Trend MT5 Scanner See more products at:   A
Special offer : ALL TOOLS , just $35 each! New tools   will be   $30   for the   first week   or the   first 3 purchases !  Trading Tools Channel on MQL5 : Join my MQL5 channel to update the latest news from me Volumatic VIDYA (Variable Index Dynamic Average) は、トレンドを追跡し、トレンドの各フェーズ内での買い圧力と売り圧力を分析するために設計された高度なインジケーターです。可変インデックス動的平均 (Variable Index Dynamic Average) をコアの動的平滑化技術として利用することで、このツールは、価格とボリュームのダイナミクスに関する重要な洞察を、市場構造の重要なレベルで提供します。 MT5バージョンを見る:  Volumatic VIDyA MT5 他の製品を見る:   全製品 To use iCus
Projection Trend - a Forex arrow indicator without redrawing does not change its signals when the market situation changes, does not adjust to the chart. The signals given by him are unambiguous. Traders build a trading system that provides good signals 80-90% of the time. The indicator showing the points of entry and exit from the market with arrows is able to bring results not only in the Forex market, but also when working with binary options. You can buy it and install it in MetaTrader you
Master Phi is an indicator based on Fibonacci numbers. It analyzes the percentage values returning the proportion of the Golden Section. You can customize values and set custom levels so you will create your personal Trading. The attention on the minimums and the maximums of timeframes allows accurate analysis in order to intercept very precisely the trading levels after the various impulse movements. Input Values Time_Frame to analyze LEVELS SETTINGS 9 levels (in percentage) 9 colors LINE SETT
This indicator identifies the major and minor swing high and low points on a chart. It then takes the most recent swing and draws a fibonacci pattern of retracement and extension levels to give you an idea of where price may move next. It allow allows you to set a pair of moving averages to help identify the direction of the overall trend. There are configuration parameters for the major and minor swing and the moving averages.
The indicator allows you to instantly determine the current trend by color and FIBO levels. Higher Timeframe the panel shows the current trend of higher periods, helping to determine the strength of the trend Trade according to the trend when changing the color of candles or trade against the trend when the price hit the extreme levels of the   FIBO Trend PRO  indicator     Advantages of the FIBO Trend PRO Indicator never repaint and does not change their values Very easy to use and intuitive
VaviStar is an indicator based on trend retracements determined by ZigZag segments. It is theorized, and statistics confirm, that stocks react to certain retracement levels. Many use Fibonacci retracement levels (23.6%, 38.2%, 61.8%). It is assumed that once the price goes beyond the 61.8% retracement, we can already speak of a trend reversal. This indicator allows you to comfortably chart a segment of the ZigZag with the relative operating levels chosen. With a reversal mindset , you can use it
Fibo label
Damir Satridinov
5 (2)
Индикатор рисует уровни Фибоначчи с выделенными Ценовыми метками.При установке индикатора на график необходимо создать трендовую линию с именем указанным в поле" Unique name of trend line to place fib on ". По умолчанию имя=" Unique name of trend line to place fib on"  =     "+"    .В индикаторе можно заменить уровни фибоначчи по своему усмотрению.Также меняются цвет,стиль,толщина линий и т. д.
FREE
外国為替トレーダーは、テクニカル分析における フィボナッチ 取引戦略の価値を理解しています。ただし、フィボナッチ レベルを手動で描画および調整するには時間がかかる場合があります。そこで、   Fibonacci Of Yesterday Ultimate インジケーターが登場します。これは、前日の価格変動に基づいてフィボナッチ戦略を使用するトレーダー向けに特別に設計されており、時間と労力を節約します。 この革新的なインジケーターは、フィボナッチレベルに基づいてエントリー、ストップロス、テイクプロフィットのレベルを自動的に識別します。また、好みに合わせて簡単にカスタマイズできる、使いやすいフィボナッチ ツールも含まれています。特徴的なのは、チャート上の実際のトレンド チャネルを識別する機能で、反転、リトレースメント、トレンドの機会を簡単に見つけることができます。 Fibonacci Of Yesterday Ultimate インジケーターの使用は簡単です。主要なニュースリリースを待ち、トレンドを判断し、それに応じてフィボナッチレベルを描画します。 50% と 38.2% のレベルの間で
このインジケーターは実践的なトレードに最適な自動波動分析のインジケーターです! 場合... 注:   Tang Lun (Tang Zhong Shuo Zen) の命名規則の影響で、私は波のグレーディングに西洋の名前を使用することに慣れていません。基本的な波を ペン 、二次波のバンドを セグメント と名付けました。同時に、 セグメント にはトレンドの方向が指定されます (この命名方法は将来のノートで使用されます。最初に言っておきます)。ただし、アルゴリズムは曲がりくねった理論とはほとんど関係がないため、付けるべきではありません。これは、私の市場分析 によって要約された、絶えず変化する複雑な運用ルール を反映しています。 バンドは標準化され、人によって異なることがないよう定義されており、市場参入を厳密に分析する上で重要な役割を果たす人為的な干渉の描画方法が排除されています。 このインジケーターを使用することは、取引インターフェイスの美しさを改善することと同等であり、元の K ライン取引を放棄し、取引の新しいレベルに連れて行きます。また、宣伝の観点から顧客の認識も向上します。 イ
What Is a Pivot Point? A pivot point is a technical analysis indicator, or calculations, used to determine the overall trend of the market over different time frames. The pivot point itself is simply the average of the intraday high and low, and the closing price from the previous trading day. On the subsequent day, trading above the pivot point is thought to indicate ongoing bullish sentiment, while trading below the pivot point indicates bearish sentimen How to Use Pivot Points The very ess
Fibonacci calculator is used with Elliot Waves, it can generate remarkable results. A trader could use these levels or ratios to find high probability trades with very small stop loss. You may also use these ratios to find Elliott Waves extensions and to book profit near those levels. For Elliot Wave experts, Fibonacci calculator is a highly useful tool that can assist them in calculating Fibonacci extension and retracement levels for the market price. The indicator proves itself as a useful one
Double Fractal Entry Bot trades automatically using fractal breakouts or rebounds. It detects precise entry points, places SL and TP based on market structure, and includes logic to manage risk and avoid false signals. Simple, smart, and powerful. This product is also available for MetaTrader 5 =>  https://www.mql5.com/en/market/product/143608 Double Fractal Entry Bot is an intelligent trading robot based on the proven logic of the Double Fractal Entry indicator. It analyzes price using upper a
MT4バージョン: https://www.mql5.com/ja/market/product/90395 MT5バージョン: https://www.mql5.com/ja/market/product/99545 積極的な取引戦略の典型である「No Marti No Party」Expert Advisor (EA) をご紹介します。 この EA は、大幅な利益または大幅な損失につながる可能性のあるハイリスク、ハイリターンの原則に基づいて動作するため、気弱な人向けではありません。 名前がすべてを物語っています。マーチンゲール戦略がこの EA の中核です。 損失を回復し、その過程で利益を上げることを目指して、負けた取引を積極的に倍増させるように設計されています。 ただし、このアプローチには鋼の神経と、潜在的なドローダウンに耐えるための多額の口座残高が必要です。 この EA の使用を検討する前に、資本要件が最小限の口座タイプである Cent 口座で広範囲にテストすることが重要です。 これにより、トレーダーはそのパフォーマンスを測定し、その激しい取引スタイルに対処できるかど
I recommend you to read the   product's blog  (manual) from start to end so that it is clear from the beginning what the indicactor offers. This multi time frame and multi symbol supply and demand zone dashboard indicator sends alerts when the price has reached a supply/demand zone. It is also possible to use it to be alerted about regular double tops/bottoms instead of zones. It can be used with all time frames from M1 to MN. It is possible to use RSI, divergence (MACD, OsMA, RSI or Awesome) a
Индикатор пригодится тем, кто использует кластеры Фибоначчи в торговле и применяет построения с разными наборами уровней. Каждый набор уровней применителен как к уровням Retracement , так и к Expansion (выбирается в настройках). Уровни задаются перечислением в формате "0;50;61.8;100". Настройки индикатора: Fibonacci #1 – Набор уровней #1 Fibonacci – Тип уровней : Retracement или Expansion Levels – Набор уровней в формате "0;23.6;38.2;50;61.8;100" Color line – Цвет линии Style line – Стиль линии
FREE
Introduction In the fast-paced world of financial market trading, success often hinges on the ability to spot and leverage trends. Among the various strategies available, momentum trading stands out as a powerful tool for traders seeking to capitalize on market movements. In this article, we will delve into the concept of momentum, its significance in trading, and the numerous benefits it offers to traders. What is Momentum? Momentum in trading refers to the tendency of assets to continue moving
Introduction to Fractal Pattern Scanner Fractal Indicator refers to the technical indicator that makes use of the fractal geometry found in the financial market. Fractal Pattern Scanner is the advanced Fractal Indicator that brings the latest trading technology after the extensive research and development work in the fractal geometry in the financial market. The most important feature in Fractal Pattern Scanner is the ability to measure the turning point probability as well as the trend probabi
This indicator Super Channel Pro indicator.Indicator displays trend movement. Indicator calculates automatically line. Features FiltPer - displays indicator channel period. deviation - displays indicator channel deviation. deviation2 - displays indicator channel deviation. How to understand the status: If the arrow is green, trend is up. If the arrow is red, trend is down. ///////////////////////////////////////////////////////////////////////////////////////////////////////////////////////////
Global Trend Indicator, shows the signals for entry. Displays both entry points and the trend itself. Shows statistically calculated moments for entering the market with arrows. When using the indicator, the risk factor can be optimally distributed. Settings: Uses all one parameter for settings. Choosing a parameter, it is necessary to visually resemble it so that the appropriate graph has a projection of extremes. Parameters: Length - the number of bars for calculating the indicator. Use
The indicator determines a special pattern of Joe Dinapoli. It gives very high probability buy and sell signals. Indicator does not repaint. Indicator Usage Buy Signal ''B'' Entry : Market buy order at signal bar close Stop : Low of signal bar Take Profit : First swing high Sell Signal ''S'' Entry : Market sell order at signal bar close Stop : High of signal bar Take Profit : First swing low Indicator Parameters Fast EMA : External Parameter (should be kept as default) Slow EMA: External Parame
このプロダクトを購入した人は以下も購入しています
An exclusive indicator that utilizes an innovative algorithm to swiftly and accurately determine the market trend. The indicator automatically calculates opening, closing, and profit levels, providing detailed trading statistics. With these features, you can choose the most appropriate trading instrument for the current market conditions. Additionally, you can easily integrate your own arrow indicators into Scalper Inside Pro to quickly evaluate their statistics and profitability. Scalper Inside
Linear Trend Predictor ー - エントリ ポイントと方向サポート ラインを組み合わせたトレンド インジケーター。高値/安値チャネルを突破するという原理に基づいて機能します。 インジケーターのアルゴリズムは市場のノイズをフィルタリングし、ボラティリティと市場の動向を考慮します。 インジケーターの機能  平滑化手法を使用して、市場のトレンドと、買い注文または売り注文を開くためのエントリー ポイントを表示します。  任意の時間枠のチャートを分析して、短期および長期の市場の動きを判断するのに適しています。  あらゆる市場や時間枠に適応可能な入力パラメータにより、トレーダーはインジケーターを独自にカスタマイズできます。  設定されたインジケーター信号は消えず、再描画もされません。ローソク足の終値で決定されます。  いくつかの種類の通知が矢印と組み合わされています。  このインジケーターは、独立した取引システムとして使用することも、他の取引システムへの追加として使用することもできます。  あらゆるレベルの経験を持つトレーダーが使用できます。 主なパラメータ Vol
「 Dynamic Scalper System 」インジケーターは、トレンド波の中でスキャルピング取引を行う手法のために設計されています。 主要通貨ペアと金でテスト済みで、他の取引商品との互換性があります。 トレンドに沿った短期的なポジションオープンのシグナルを提供し、追加の価格変動サポートも提供します。 インジケーターの原理 大きな矢印はトレンドの方向を決定します。 トレンド波の中では、小さな矢印の形でスキャルピングシグナルを生成するアルゴリズムが機能します。 赤い矢印は強気方向、青い矢印は弱気方向です。 トレンドの方向には敏感な価格変動ラインが描かれ、小さな矢印のシグナルと連動します。 シグナルは次のように機能します。適切なタイミングでラインが現れるとエントリーシグナルが形成され、ラインが開いている間はポジションが保持され、完了すると取引が終了します。 推奨される動作時間枠はM1~H4です。 矢印は現在のローソク足に形成され、次のローソク足が開いている場合は、前のローソク足の矢印は再描画されません。 入力パラメータ Trend Wave Period - トレンド方向
まず第一に、この取引インジケーターは再描画されず、再描画されず、遅延しないことを強調する価値があります。これにより、手動取引とロボット取引の両方に理想的なものになります。 ユーザーマニュアル:設定、入力、戦略。 アトミックアナリストは、価格の強さとモメンタムを利用して市場でより良いエッジを見つけるためのPA価格アクションインジケーターです。ノイズや誤ったシグナルを除去し、取引ポテンシャルを高めるための高度なフィルターを備えています。複雑なインジケーターの複数のレイヤーを使用して、アトミックアナリストはチャートをスキャンし、複雑な数学的計算をシンプルなシグナルと色に変換します。これにより、どのような初心者トレーダーでも理解して使用し、一貫した取引の決定を行うことができます。 「アトミックアナリスト」は、新規および経験豊富なトレーダー向けにカスタマイズされた包括的な取引ソリューションです。プレミアムインジケーターとトップノッチの機能を1つの取引戦略に組み合わせ、すべてのタイプのトレーダーにとって汎用性のある選択肢にします。 デイリートレーディングとスキャルピング戦略:高速で正確な
トレンドラインプロ   市場の真の方向転換点を理解するのに役立ちます。この指標は、真のトレンド反転と主要プレーヤーが再び参入するポイントを示します。 分かりますか     BOSライン   複雑な設定や不要なノイズなしに、より長い時間足でのトレンドの変化と重要なレベルを把握できます。シグナルは再描画されず、バーが閉じた後もチャート上に残ります。 VERSION MT 5     -     RFI LEVELS PRO インジケーター と組み合わせることで、その潜在能力を最大限に発揮します。 インジケーターが示す内容: 本当の変化   トレンド(BOSライン) 一度シグナルが現れたら、それは有効です!これは、リペイント機能を持つインジケーターとの重要な違いです。リペイント機能を持つインジケーターは、シグナルを発した後、それを変更し、資金の損失につながる可能性があります。これにより、より高い確率と精度で市場に参入できます。また、矢印が現れた後、目標値(利益確定)に達するか、反転シグナルが現れるまで、ローソク足の色を変更する機能もあります。 繰り返しエントリ       主要プレーヤーの
NAM Order Blocks
NAM TECH GROUP, CORP.
3.67 (3)
MT4マルチタイムフレームオーダーブロック検出インジケーター。 特徴 -チャートコントロールパネルで完全にカスタマイズ可能で、完全な相互作用を提供します。 -必要な場所でコントロールパネルを表示および非表示にします。 -複数の時間枠でOBを検出します。 -表示するOBの数量を選択します。 -さまざまなOBユーザーインターフェイス。 -OBのさまざまなフィルター。 -OB近接アラート。 -ADRの高線と低線。 -通知サービス(画面アラート|プッシュ通知)。 概要 注文ブロックは、金融機関や銀行からの注文収集を示す市場行動です。著名な金融機関と中央銀行が外国為替市場を牽引しています。したがって、トレーダーは市場で何をしているのかを知る必要があります。市場が注文ブロックを構築するとき、それは投資決定のほとんどが行われる範囲のように動きます。 注文の構築が完了すると、市場は上向きと下向きの両方に向かって急激に動きます。注文ブロック取引戦略の重要な用語は、機関投資家が行っていることを含むことです。それらは主要な価格ドライバーであるため、機関投資家の取引を含むあらゆる戦
GOLD Impulse with Alert
Bernhard Schweigert
4.67 (12)
このインディケータは、当社の2つの製品 Advanced Currency IMPULSE with ALERT  +   Currency Strength Exotics . のスーパーコンビネーションです。 このインジケーターは全ての時間枠で作動し、8つの主要通貨と1つのシンボルの強弱のインパルスをグラフで表示します。 このインジケータは、金、エキゾチックペア、商品、インデックス、先物など、あらゆるシンボルの通貨強度の加速度を表示することに特化されています。金、銀、原油、DAX、US30、MXN、TRY、CNHなどの通貨強度の加速度(インパルスまたは速度)を表示するために、任意のシンボルを9行目に追加できる、この種の最初のものです。 新しいアルゴリズムに基づいて構築され、潜在的な取引の特定と確認がさらに容易になりました。これは、通貨の強さや弱さが加速しているかどうかをグラフィカルに表示し、その加速の速度を測定するためです。加速すると物事は明らかに速く進みますが、これはFX市場でも同じです。つまり、反対方向に加速している通貨をペアリングすれば、潜在的に利益を生む取引を特定
MTF Supply Demand Zones
Georgios Kalomoiropoulos
4.82 (22)
次世代の自動化された需要と供給のゾーン。どのチャートでも機能する新しい革新的なアルゴリズム。すべてのゾーンは、市場の価格行動に従って動的に作成されています。 2種類のアラート --> 1) 価格がゾーンに達したとき 2) 新しいゾーンが形成されたとき もう 1 つの役に立たない指標はありません。実績のある完全な取引戦略を手に入れることができます。     新機能:     価格が需給ゾーンに達したときにアラートを出す     新しい需給ゾーンが作成されたときにアラートを発します     プッシュ通知アラート     ピップ単位のゾーン幅ラベル     MTF のもう 1 つのタイムフレーム。したがって、現在より 2 時間足高いのではなく、現在より 3 時間足し上に見えるようになります。     アラート/ゾーン/MTF 機能を有効/無効にするボタン あなたが得る利点:     取引から感情を取り除きます。     取引エントリをオブジェクト化します。     確率の高いセットアップで利益を上げましょう。     描画ゾーンから時間を節約します。
現在20%OFF! 初心者やエキスパートトレーダーに最適なソリューションです。 このインディケータは、エキゾチックペア・コモディティ・インデックス・先物など、あらゆるシンボルの通貨の強さを表示することに特化したインディケータです。金、銀、原油、DAX、US30、MXN、TRY、CNHなどの通貨の強さを表示するために、9行目にどのシンボルでも追加することができます。独自の機能を多数搭載し、新しい計算式を採用したため、ユニークで高品質、かつ手頃な価格のトレーディングツールとなっています。新しいトレンドやスキャルピングチャンスのトリガーポイントを正確に把握することができるため、あなたのトレードがどのように改善されるか想像してみてください。 ユーザーマニュアル:ここをクリック   https://www.mql5.com/en/blogs/post/708876 すべての時間枠に対応します。あなたはすぐにトレンドを見ることができるようになります! 新しいアルゴリズムに基づいて設計されているため、潜在的な取引の特定と確認がより簡単になります。これは、8つの主要通貨と1つのシンボルの強弱
MetaForecast M4
Vahidreza Heidar Gholami
5 (2)
MetaForecastは、価格データのハーモニクスに基づいて、どんな市場の未来を予測し視覚化します。市場が常に予測可能ではありませんが、価格にパターンがある場合、MetaForecastは可能な限り正確な未来を予測できます。他の類似製品と比較して、MetaForecastは市場のトレンドを分析することでより正確な結果を生成することができます。 入力パラメータ Past size (過去のサイズ) MetaForecastが将来の予測を生成するために使用するバーの数を指定します。モデルは選択したバー上に描かれた黄色の線で表されます。 Future size (将来のサイズ) 予測すべき将来のバーの数を指定します。予測された将来は、ピンクの線で表示され、その上に青い回帰線が描かれます。 Degree (程度) この入力は、MetaForecastが市場で行う分析のレベルを決定します。 Degree 説明  0 Degree 0の場合、価格の全てのピークや谷、そして詳細をカバーするために、「Past size」の入力に大きな値を使用することが推奨されています。  1 (推奨) Degre
Introducing the Delta Volume Profile Indicator - Unleash the Power of Institutional Precision!  Technical Indicator: Are you ready to trade like the pros? The Delta Volume Profile Indicator is no ordinary tool. It’s a high-precision, cutting-edge indicator that puts the power of institutional-grade trading in your hands. This unique indicator analyses delta volume distribution in real-time, revealing the market's hidden buy/sell imbalances that the biggest financial institutions rely on to antic
Order Block Hunter
Noha Mohamed Fathy Younes Badr
5 (10)
Order block hunter indicator is the best indicator for  hunt the order blocks that area where there has been a large concentration of limit orders waiting to be executed Order blocks are identified on a chart by observing previous price action and looking for areas where the price experienced significant movement or sudden changes in direction .This indicator does that for you by using very complicated codes and helps you to take the best areas To buy and sell because it make marks at the best a
Dynamic Forex28 Navigator - 次世代の Forex 取引ツール。 現在 49% オフ。 Dynamic Forex28 Navigator は、長年人気のインジケーターを進化させたもので、3 つの機能を 1 つにまとめています。 Advanced Currency Strength28 インジケーター (レビュー 695 件)  + Advanced Currency IMPULSE with ALERT (レビュー 520 件) + CS28 コンボ シグナル (ボーナス)。 インジケーターの詳細 https://www.mql5.com/en/blogs/post/758844 次世代の Strength インジケーターが提供するもの  オリジナルで気に入っていたすべての機能が、新機能と精度の向上によって強化されました。 主な機能: 独自の通貨強度計算式。 すべての時間枠でスムーズかつ正確な強度ライン。 トレンドの特定と正確なエントリーに最適です。 ダイナミックマーケットフィボナッチレベル (マーケットフィボナッチ)。 このインジケーターに固有
Advanced Supply Demand
Bernhard Schweigert
4.91 (299)
現在40%オフ 初心者にもエキスパートトレーダーにも最適なソリューション このインジケーターは独自の機能と新しい公式を多数内蔵しており、ユニークで高品質かつ手頃な取引ツールです。このアップデートでは、2つの時間枠ゾーンを表示できるようになります。より長いTFだけでなく、チャートTFとより長いTF(ネストゾーンを表示)の両方を表示できます。すべてのSupply Demandトレーダーの皆さんのお気に召すはずです。:) 重要情報の公開 Advanced Supply Demandの可能性を最大化するには、 https://www.mql5.com/ja/blogs/post/720245 にアクセスしてください。   エントリーまたはターゲットの正確なトリガーポイントを正確に特定できれば取引がどのように改善されるか想像してみてください。新しい基盤となるアルゴリズムに基づいて構築されているため、買い手と売り手の間の潜在的な不均衡をさらに簡単に特定できます。これは、最も強い需要と供給のゾーンと、過去のパフォーマンス(古いゾーンを表示)がグラフィカルに表現されるためです。これらの機能は、最適な
このインジケーターは、反転ポイントと価格戻りゾーンを正確に表示します。     主要プレーヤー 。新たなトレンドが形成される場所を把握し、最大限の精度で意思決定を行い、すべての取引をコントロールします。 TREND LINES PRO インジケーターと組み合わせることで、その潜在能力を最大限に発揮します。 VERSION MT5 インジケーターが示す内容: 新しいトレンドの始まりに活性化する反転構造と反転レベル。 リスクと報酬の比率を最小限に抑えた利益 確定 と 損失停止の レベルの表示     RR 1:2   。 インテリジェントな削減ロジックによるストップロス。 指定されたインジケーターから 2 つのトレンド タイプの反転パターンを表示します。 指標: トレンドを追う   TREND LINES PRO   (世界的なトレンドの変化) TREND PRO   (クイックトレンド変更) シンプルで効果的   スキャナー   リアルタイムトレンド(新機能)。 マルチタイムフレームのインストゥルメント フィルタリング。 画面   利益     LOGIC AI信号の後。 当日プラス方
Adaptive Volatility Range [AVR] is a powerful tool for identifying key trend reversal points. AVR accurately reflects the Average True Range (ATR) of volatility, taking into account the Volume-Weighted Average Price (VWAP). The indicator adapts to any market volatility by calculating the average volatility over a specific period, ensuring a stable rate of profitable trades. You receive not just an indicator but a professional automated trading system , AVR-EA . Advantages: Automated Trading Sys
説明書(ロシア語)  /  説明書 (英語)  /  バージョン MT5 主な機能: 売り手と買い手のアクティブなゾーンを表示します。 このインジケーターは、買いと売りの適切な最初のインパルスレベル/ゾーンをすべて表示します。これらのレベル/ゾーンがアクティブになると、エントリーポイントの探索が始まり、レベルの色が変わり、特定の色で塗りつぶされます。状況をより直感的に把握できるように、矢印も表示されます。 LOGIC AI - テンプレートをアクティブ化するときにエントリポイントを検索するためのゾーン(円)の表示 視認性を向上させるため、人工知能を用いて進入ポイントを探索したゾーンを表示する機能が追加されました。 より高い時間枠からのレベル/ゾーンの表示(MTFモード) より長い時間間隔でレベル/ゾーンを表示する機能を追加しました。また、インジケーターに自動トレンド検出機能(   TPSproTREND PRO   )を実装しました。 取引のための個別の専門的なステップバイステップのアルゴリズム このアルゴリズムは、トレンドの方向と逆方向の両方でデイトレードを行うために設計されていま
BTMM State Engine Pro is a MetaTrader 4 indicator for traders who use the Beat The Market Maker approach: Asian session context, kill zone timing, level progression, peak formation detection, and a multi-pair scanner from a single chart. It combines cycle state logic with a built-in scanner dashboard so you do not need the same tool on many charts at once. What it does Draws the Asian session range; session times can follow broker server offset or be set in inputs. Tracks level progression (L
Volatility Trend System - a trading system that gives signals for entries. The volatility system gives linear and point signals in the direction of the trend, as well as signals to exit it, without redrawing and delays. The trend indicator monitors the direction of the medium-term trend, shows the direction and its change. The signal indicator is based on changes in volatility and shows market entries. The indicator is equipped with several types of alerts. Can be applied to various trading ins
Looking for a powerful yet lightweight swing detector that accurately identifies market structure turning points? Want clear, reliable buy and sell signals that work across any timeframe and any instrument? Buy Sell Arrow MT Swing is built exactly for that — precision swing detection made simple and effective. This indicator identifies Higher Highs (HH) , Higher Lows (HL) , Lower Highs (LH) , and Lower Lows (LL) with remarkable clarity. It is designed to help traders easily visualize market stru
現在40%OFF! 初心者やエキスパートトレーダーのためのベストソリューション! このダッシュボードソフトウェアは、28の通貨ペアで動作しています。それは私達の主要な指標(高度な通貨の強さ28と高度な通貨インパルス)の2に基づいています。それは全体の外国為替市場の大きい概観を与えます。それは、すべての(9)時間枠で28の外国為替ペアのための高度な通貨の強さの値、通貨の動きの速度と信号を示しています。チャート上で1つのインディケータを使用して市場全体を観察し、トレンドやスキャルピングの機会をピンポイントで見つけることができたら、あなたのトレードがどのように改善されるか想像してみてください。 このインディケータには、強い通貨と弱い通貨の識別、潜在的な取引の識別と確認がより簡単になるような機能が搭載されています。このインディケータは、通貨の強さや弱さが増加しているか減少しているか、また、すべての時間枠でどのように機能しているかをグラフィカルに表示します。 新機能として、現在の市場環境の変化に適応するダイナミックなマーケットフィボナッチレベルが追加され、すでに当社のAdvanced
このインジケーターを購入すると、プロ仕様のトレードマネージャーを無料で差し上げます。 まず第一に、このトレーディングシステムがノンリペイント、ノンリドロー、ノンラグのインジケーターであることを強調する価値がある。これにより、手動取引とロボット取引の両方に理想的なものになっています。 オンラインコース、マニュアル、プリセットのダウンロード。 「スマートトレンドトレーディングシステム MT5」は、新規および経験豊富なトレーダー向けにカスタマイズされた包括的なトレーディングソリューションです。10以上のプレミアムインジケーターを組み合わせ、7つ以上の堅実なトレーディング戦略を備えており、多様な市場状況に対応する多目的な選択肢となっています。 トレンドフォロー戦略:トレンドを効果的に乗り越えるための正確なエントリーとストップロス管理を提供します。 リバーサル戦略:潜在的なトレンドの反転を特定し、トレーダーがレンジ相場を活用できるようにします。 スキャルピング戦略:高速で正確なデイトレードおよび短期取引のために設計されています。 安定性:すべてのインジケーターはノンリペイント、ノンリドロー、ノ
Trend Screener
STE S.S.COMPANY
4.79 (95)
トレンドインジケーター、1つのツールに組み込まれたすべての重要なトレンド機能を備えたトレンドトレーディングとフィルタリングのための画期的なユニークなソリューション! これは、すべてのシンボル/商品(外国為替、商品、暗号通貨、インデックス、株式)で使用できる100%再描画されていないマルチタイムフレームおよびマルチ通貨インジケーターです。 期間限定オファー: サポートおよびレジスタンス スクリーナー インジケーターは、たった 50 ドルで永久的にご利用いただけます。(元の価格 250 ドル) (オファー延長) トレンドスクリーナーは、チャート内のドットで矢印トレンドシグナルを提供するインジケーターに続く効率的なインジケーターです。 トレンド分析インジケーターで使用できる機能: 1.トレンドスキャナー。 2.最大利益分析を備えたトレンドライン。 3.トレンド通貨強度メーター。 4.アラート付きのトレンド反転ドット。 5.アラート付きの強いトレンドドット。 6.トレンド矢印 毎日の分析例、毎日のシグナルパフォーマンス...など、トレンドスクリーナーインジケーターを使用して、ここで見つけること
GEM Signal Pro GEM Signal Pro は、MetaTrader 4 向けのトレンドフォロー型インジケーターです。より明確なシグナル、より整理されたトレードセットアップ、そして実用的なリスク管理をチャート上で確認したいトレーダーのために設計されています。 単純な矢印だけを表示するのではなく、GEM Signal Pro はトレード全体の考え方を、より見やすく分かりやすい形で表示します。条件が確認されると、インジケーターはエントリー価格、ストップロス、利確目標をチャート上に表示し、トレードセットアップをより効率的に確認できるようにします。 動作の仕組み このインジケーターは、まず内部ロジックに基づいて有効なシードシグナルを検出します。 確認条件が満たされると、GEM Signal Pro はチャート上に完全なセットアップを表示します。これにより、トレーダーはトレード構造をより明確に把握し、手作業による分析を減らすことができます。 チャート上のトレードレベル 確認済みシグナルに対して、GEM Signal Pro は以下を表示できます。 エントリー価格 ストップロス テ
Introduction Harmonic Patterns are best used to predict potential turning point. Traditionally, Harmonic Pattern was identified manually connecting peaks and troughs points in the chart. Manual harmonic pattern detection is painfully tedious and not suitable for everyone. You are often exposed under subjective pattern identification with manual pattern detection. To avoid these limitations, Harmonic Pattern Plus was designed to automate your harmonic pattern detection process. The functionality
CRT Multi-Timeframe Market Structure & Liquidity Sweep Indicator Non-Repainting | Multi-Asset | MT5 Version Available MT5 Version:   https://www.mql5.com/en/market/product/162075 Full User Guide — explains what each feature does and why:   https://www.mql5.com/en/blogs/post/767525 Quick Start User Guide  — explains how to configure and in what order:  https://www.mql5.com/en/blogs/post/767540 Indicator Overview CRT Ghost Candle HTF Fractal is a complete institutional-grade market structure too
Was: $299  Now: $99   Supply Demand uses previous price action to identify potential imbalances between buyers and sellers. The key is to identify the better odds zones, not just the untouched ones. Blahtech Supply Demand indicator delivers functionality previously unavailable on any trading platform. This 4-in-1 indicator not only highlights the higher probability zones using a multi-criteria strength engine, but also combines it with multi-timeframe trend analysis, previously confirmed swings
Hi, I made one of best sygnalizators on a stock markets. It's prepared for a pro players. There is not even, a one mistake. It works on every timeframe and every stock market. Test it before you say something, in my 7 years I check houndreds of fakes. This one work right in time, not in slow motions. It' s a dot with 3 levels of strong power depends on how strong market is. If power is high you have very profitable results but the most important it's allways on time. So it is protecting your acc
The Reversal Master is an indicator for determining the current direction of price movement and reversal points. The indicator will be useful for those who want to see the current market situation better. The indicator can be used as an add-on for ready-made trading systems, or as an independent tool, or to develop your own trading systems. The Reversal Master indicator, to determine the reversal points,  analyzes a lot of conditions since the combined analysis gives a more accurate picture of t
Miraculous Indicator – ガン・スクエア・オブ・ナインに基づく100%非リペイントのFXおよびバイナリーツール この動画では、FXおよびバイナリーオプションのトレーダー向けに特別に開発された、非常に正確で強力な取引ツールである Miraculous Indicator を紹介しています。このインジケーターがユニークなのは、伝説的な ガン・スクエア・オブ・ナイン と ガンの振動の法則 に基づいている点で、現代の取引で利用できる最も正確な予測ツールの一つとなっています。 Miraculous Indicatorは 完全に非リペイント であり、ローソク足が確定した後にシグナルが変化したり消えたりすることはありません。つまり、見たものがそのまま利用できます。これにより、トレーダーは自信を持ってエントリーおよびエグジットを行うための信頼性と一貫性のある根拠を得ることができます。 主な特徴: ガン・スクエア・オブ・ナインとガン理論に基づいて構築 100%非リペイントのシグナルシステム すべての時間枠(M1、M5、H1、H4、日足、週足)で機能 FXおよびバイナリーオプション取引
作者のその他のプロダクト
Marcus = market customization is 3 in 1 indicator. Universal business tool from professional traders that helps visualizing interesting market situations. Preview markets using price action and sentiment in the market. Three tools necessary to understand the market situation and the anticipation of further movement. Finally, you will see what parquet traders see. With these tools, you will see the important supports and resistances. It shows you the entry of big players on the market. The indica
Hidden123Gap (123Gap) is universal business tool from the professional traders that helps to visualize market situation. It previews markets using a price action and a sentiment in the market. The tool is necessary to understand the market situation and the anticipation of further movement. Finally, you will see how traders estimate the market. With this tool, you will see important supports and resistances. It shows you the entry of big players on the market. The indicator works on all timefram
PivotHighLow. Universal business tool from professional traders that helps to visualize interest market situations. It previews markets using a price action and sentiment in the market. Tool is necessary to understand the market situation and the anticipation of further movement. Finally, you will see how traders estimate the market. With this tool, you will see important supports and resistances. It shows you the entry of big players on the market. The indicator works on all timeframes. You are
InitialBalance. Universal business tool from professional traders that helps to visualize interest market situations. It previews markets using a price action and sentiment in the market. Tool necessary to understand the market situation and the anticipation of further movement. Finally, you will see how traders estimate the market. Who knows the first steps in the market can estimate the point where the market will stop and reflect! With this tool, you will see important supports and resistance
Extender represents a multifunctional indicator which can be used for own investing strategy or can be easily adopted as a part your own investing strategy. After installation as a secondary indicator you can see a multiframe visualization of selected timeframes of analyzed underlying asset. The multiframe visualization has a few modifications which can be selected in section Indicator Setup. Input parameters Indicator setup Timeframes – definition of selected timeframes for visualization, e.g.
Sensor utility is a tool for protecting the capital against unexpected market movements. Today's markets are unpredictable. Are you afraid of big moves? This tool monitors the movements of the market and may remove pending orders or open positions while increased volatility. The utility works with the actual movement of the market. The indicator works on all timeframes. You are not limited by use of different timeframes, the indicator is able to adapt. On the screenshots, you can see basic setti
A new way of managing your trades – efficiently, automatically and with no emotions. Control various markets and manage many different trades at one moment. Grasp your competitive advantage and ultimately find out what profitable trading looks like! Trademanager is a piece of software developed for MT4 platforms. This tool enables you to completely set up all parameters for many different trades on many different markets – at one time and with no emotions as psychological obstacles. Must-need to
Price level alert is a software that gives you an overview of your all drawn levels (supports and resistances) for more than 10 markets in only one elegant table which you can see right in your chart. Price alert is not only this, it also sends you notification (alert) when a market has reached one of your predefined levels. Therefore, this is a must-have tool for all traders who want to cut the time sitting in front of a computer significantly and not to miss any trade. Settings (inputs) Symbo
The Baseline Balance tool shows multiple pivot lines for short, mid and long time market cycles. Thus trader can easy identify local or global S/R (support/resistance) levels for better timing of investments and entries to the market. Due to the multifunctional menu directly on chart the settings is fast and accurate. Pivot lines are generated for H1, H4, Daily, Weekly, Monthly, Yearly timeshares. Menu on chart shows following settings: Line Display Settings Middle_Lines – shows middle calculati
フィルタ:
レビューなし
レビューに返信