Multi TimeFrame Currency Meter
- Indikatoren
- Version: 1.7
- Aktualisiert: 16 Oktober 2025
- Aktivierungen: 5

Dieser Currency Meter berechnet die Stärke anhand eines Währungskorbs von 28 Paaren?
Dieser Currency Meter verwendet einen Korb von 28 Währungspaaren, um die Stärke zu definieren. Dies ist sehr wichtig, weil es eine ganzheitliche Sicht auf die Stärke einer Währung gibt, indem es ihre Reaktion auf alle mit ihr gepaarten Hauptwährungen berücksichtigt.
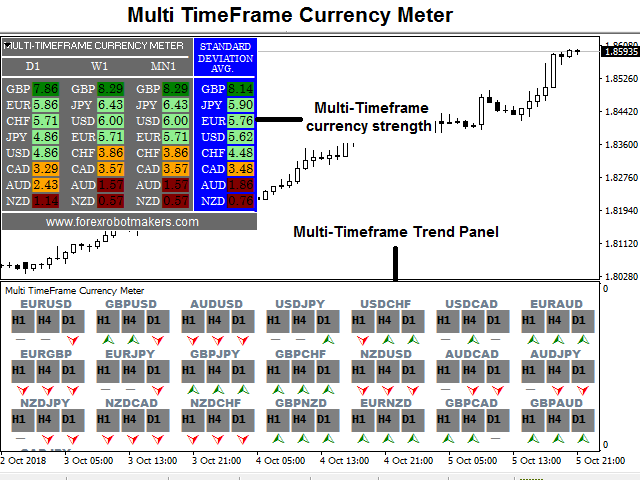
Dieser Currency Meter ist ein Multi-Timeframe!!!
Die Mehrheit der Währungsstärkeindikatoren, die heute auf dem Markt sind, haben nur einen einzigen Zeitrahmen. Selbst bei den so genannten Multi-Timeframe-Versionen wird Ihnen eine Liste von Zeitrahmen zur Verfügung gestellt, aber Sie können trotzdem nur einen einzigen Zeitrahmen pro Chart anzeigen.
Dieser Indikator zeigt die Währungsstärken verschiedener Zeitrahmen in einem Diagramm an und gibt Ihnen so ein klares Bild der lang- und kurzfristigen Stimmungen des Marktes in einer einzigen Ansicht.
Eine weitere Besonderheit dieses Währungsmeters ist das Multi-Timeframe Averaging!
Die angezeigte Endstärke ist ein Durchschnittswert aus 3 Zeitrahmen. Warum ist das wichtig?
Auch wenn ein langfristiger Trend die kurzfristige Marktstimmung bestimmt, so ist es doch die kurzfristige Stimmung, die den langfristigen Trend bestimmt. Ich habe mehrere Fälle erlebt, in denen eine einzige Pressemitteilung die Richtung eines Trends auf unbestimmte Zeit geändert hat. Um die Währungsstärke klar zu definieren, müssen Sie also sowohl höhere als auch niedrigere Zeitrahmen berücksichtigen.
Informationen, die Sie mit diesem Währungsstärkemesser erhalten können
- Richtung eines Trends: Durch den Vergleich der Stärken der beiden Währungen eines Paares kann die Richtung dieses Paares leicht abgeleitet werden. Z.B. EUR=7,9, USD=2,9. Dann befindet sich EURUSD in einem Aufwärtstrend, weil der EUR stärker ist als der USD.
- Stärke eines Trends: Die Stärke des Trends eines bestimmten Paares lässt sich einfach aus der Differenz zwischen den Werten der Währungen, die das Paar bilden, ableiten.
Beispiel 1: AUD=6,0, USD=5,9. Die Differenz beträgt nur (6,0-5,9=0,1). Dies ist ein sehr schwacher Trend.
Beispiel 2: AUD=8,0, USD=3,0. Die Differenz beträgt (8,0-3,0=5,0). Dies ist ein sehr starker Trend. - Volatilität: Anhand der Differenz zwischen den Währungen eines Paares können Sie leicht die Volatilität dieses Paares ableiten. Eine Differenz von weniger als drei (3,0) bedeutet eine schwache Bewegung und ist somit ein Hinweis auf eine geringe Volatilität. Eine Differenz von mehr als vier (4,0) bedeutet eine starke Bewegung und damit eine hohe Volatilität.
Dies sind nur einige der allgemeinen Informationen, die Sie von diesem Währungsstärkemesser erhalten können, aber die Liste geht weiter, je nach Ihrer Handelsstrategie.
Eingabe-Menü
- Zeitrahmen 1: Erster Zeitrahmen
- Zeitrahmen 2: Zweiter Zeitrahmen
- Zeitrahmen 3: Dritter Zeitrahmen
- TrendPanelBackGround: Editierbare Panel-Hintergrundfarbe.
- TrendPanelText: Editierbare Textfarbe des Panels.
SIE KÖNNEN JETZT KOSTENLOSE VERSIONEN UNSERER KOSTENPFLICHTIGEN INDIKATOREN HERUNTERLADEN. DAS IST UNSERE ART, DER GEMEINSCHAFT ETWAS ZURÜCKZUGEBEN!


I have spent a lot of time with various currency meters and know their strengths, weaknesses and failings. This currency Meter is a robust useful and effective tool. Although it is Daily, Weekly and Monthly, because of the way it works it is far more sensitive at those settings than you would intuitively expect. That is why one of the reviews here find it changes so often on lower timeframes. The daily for instance picks up intra day trends well that are tradeable on a 1min timeframe at s/r (once a trend is established) well without being quite as sensitive as some other methods. It strikes a good optimal balance for me between sensitive and stable. The developer has modded it so it is stable when it starts on a new period.
I have contacted the developer for help and he has been extremely accommodating, quick to reply and more helpful than I'd have expected.